WTI Price Analysis: Further downside hinges on $79.80 break


  • WTI braces for first weekly loss in three on breaking 50-SMA, fortnight-long trend line.
  • U-turn from two-month-old resistance, bearish MACD signals also keeps sellers hopeful.
  • Ascending trend line from early January challenges immediate downside.

WTI crude oil remains on the back foot as it braces for the first weekly loss, after a fortnight of an uptrend, amid early Thursday in Europe.

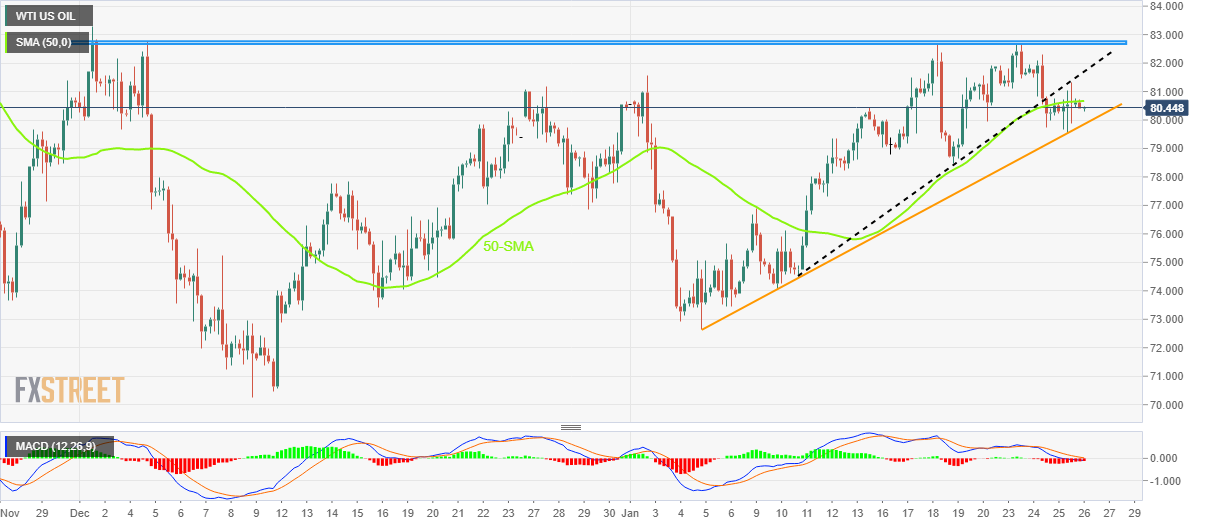
The black gold’s latest weakness could be linked to its failure to cross the horizontal resistance area comprising multiple hurdles marked since early December 2022. Also, a clear downside break of the two-week-old ascending trend line and the 50-SMA joins the bearish MACD signals to bolster the downside bias.

However, an upward-sloping support line from January 06, close to $79.80 by the press time, restricts the nearby downside of the black gold.

Following that, the previous weekly low near $78.50 could act as an additional downside filter, a break of which may recall the Oil bears targeting the $70.00 round figure. During the fall, the monthly low and December’s bottom could probe the sellers around $72.60 and $70.25 in that order.

Alternatively, 50-SMA restricts WTI’s immediate upside near $80.70 ahead of the support-turned-resistance line from mid-January, close to $81.70 at the latest.

It’s worth noting, however, that the WTI bulls need to offer a successful break of the two-month-old horizontal hurdle surrounding $82.80, to retake control.

WTI: Four-hour chart

Trend: Further downside expected

Additional important levels

Overview
Today last price 80.43
Today Daily Change -0.21
Today Daily Change % -0.26%
Today daily open 80.64
 
Trends
Daily SMA20 78.5
Daily SMA50 77.86
Daily SMA100 81.69
Daily SMA200 91.63
 
Levels
Previous Daily High 81.31
Previous Daily Low 79.54
Previous Weekly High 82.67
Previous Weekly Low 78.48
Previous Monthly High 83.3
Previous Monthly Low 70.27
Daily Fibonacci 38.2% 80.63
Daily Fibonacci 61.8% 80.21
Daily Pivot Point S1 79.68
Daily Pivot Point S2 78.72
Daily Pivot Point S3 77.91
Daily Pivot Point R1 81.45
Daily Pivot Point R2 82.27
Daily Pivot Point R3 83.23


Share: Feed news

Information on these pages contains forward-looking statements that involve risks and uncertainties. Markets and instruments profiled on this page are for informational purposes only and should not in any way come across as a recommendation to buy or sell in these assets. You should do your own thorough research before making any investment decisions. FXStreet does not in any way guarantee that this information is free from mistakes, errors, or material misstatements. It also does not guarantee that this information is of a timely nature. Investing in Open Markets involves a great deal of risk, including the loss of all or a portion of your investment, as well as emotional distress. All risks, losses and costs associated with investing, including total loss of principal, are your responsibility. The views and opinions expressed in this article are those of the authors and do not necessarily reflect the official policy or position of FXStreet nor its advertisers. The author will not be held responsible for information that is found at the end of links posted on this page.

If not otherwise explicitly mentioned in the body of the article, at the time of writing, the author has no position in any stock mentioned in this article and no business relationship with any company mentioned. The author has not received compensation for writing this article, other than from FXStreet.

FXStreet and the author do not provide personalized recommendations. The author makes no representations as to the accuracy, completeness, or suitability of this information. FXStreet and the author will not be liable for any errors, omissions or any losses, injuries or damages arising from this information and its display or use. Errors and omissions excepted.

The author and FXStreet are not registered investment advisors and nothing in this article is intended to be investment advice.

Recommended content


Recommended content

Editors’ Picks

GBP/USD rises to near 1.2540, driven by higher UK GDP

GBP/USD rises to near 1.2540, driven by higher UK GDP

GBP/USD edged higher to near 1.2540 during Asian hours on Friday, buoyed by the release of higher-than-expected UK Gross Domestic Product (GDP) data for the first quarter.

GBP/USD News

EUR/USD: The crucial resistance level will emerge at the 1.0790–1.0800 region

EUR/USD: The crucial resistance level will emerge at the 1.0790–1.0800 region

The EUR/USD pair trades on a softer note near 1.0775 during the early European hours on Friday. The downtick of the major pair is supported by the renewed US Dollar demand amid hawkish comments from Federal Reserve officials. 

EUR/USD News

Gold price attracts some buyers despite hawkish Fedspeak

Gold price attracts some buyers despite hawkish Fedspeak

Gold price edges higher for the second consecutive day on Friday. Weak employment data bolstered the speculation that the weakening economy would force the Fed to cut rates.

Gold News

XRP tests support at $0.50 as Ripple joins alliance to work on blockchain recovery

XRP tests support at $0.50 as Ripple joins alliance to work on blockchain recovery

XRP trades around $0.5174 early on Friday, wiping out gains from earlier in the week, as Ripple announced it has joined an alliance to support digital asset recovery alongside Hedera and the Algorand Foundation. 

Read more

Rate cut optimism fuelled by higher US jobless claims

Rate cut optimism fuelled by higher US jobless claims

With Federal Reserve policy acting as the primary driver of investor sentiment in 2024, renewed optimism surrounding the possibility of rate cuts has propelled the Dow to its most significant rally since December. 

Read more

Forex MAJORS

Cryptocurrencies

Signatures