|

WTI Price Analysis: Consolidates losses above $39.00, no-entry for bulls yet

  • WTI attempts recovery moves from intraday low of $39.33.
  • In the 4-hour chart, 50-bar SMA offers immediate support, 200-bar SMA guards upside moves.
  • Two-week-old ascending trend line, Friday’s top add filters to the momentum.

WTI picks up bids near $39.57 during the pre-European trading on Wednesday. Though, the black gold still drops 0.55% intraday by the press time.

While in the 4-hour chart the 50-bar SMA restricts the energy benchmark’s short-term declines, recovery moves are tamed by 23.6% Fibonacci retracement of September 08-18 upside and the 200-bar SMA.

Considering the latest pullback moves, WTI oil prices are likely to trim additional losses by challenging the 23.6% Fibonacci retracement level of $40.51. However, $40.00 may offer an intermediate halt during the rise.

Further to question buyers are the 200-bar SMA level of $41.23 and Friday’s top near $41.75.

Alternatively, the September 09 high of $38.68 can be tested on the break of $39.46 level, comprising immediate SMA support.

Also questioning the WTI weakness will be an upward sloping trend line from the early-month lows, at $38.00 now.

WTI four-hour chart

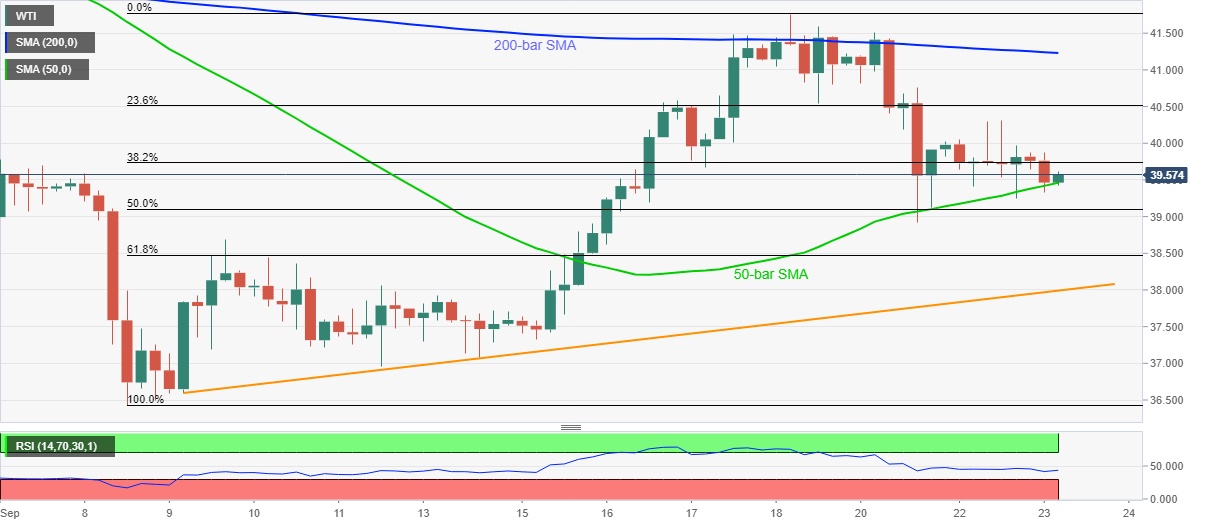
Trend: Pullback expected

Additional important levels

Overview
Today last price39.54
Today Daily Change-0.25
Today Daily Change %-0.63%
Today daily open39.79
 
Trends
Daily SMA2040.34
Daily SMA5041.25
Daily SMA10038.55
Daily SMA20040.74
 
Levels
Previous Daily High40.31
Previous Daily Low39.24
Previous Weekly High41.75
Previous Weekly Low37.08
Previous Monthly High43.86
Previous Monthly Low39.75
Daily Fibonacci 38.2%39.65
Daily Fibonacci 61.8%39.9
Daily Pivot Point S139.25
Daily Pivot Point S238.71
Daily Pivot Point S338.19
Daily Pivot Point R140.32
Daily Pivot Point R240.85
Daily Pivot Point R341.39

Author

Anil Panchal

Anil Panchal

FXStreet

Anil Panchal has nearly 15 years of experience in tracking financial markets. With a keen interest in macroeconomics, Anil aptly tracks global news/updates and stays well-informed about the global financial moves and their implications.

More from Anil Panchal
Share:

Editor's Picks

EUR/USD slumps below 1.1750 as USD benefits from risk-aversion

EUR/USD comes under renewed bearish pressure in the European session and trades below 1.1750 following a recovery attempt earlier in the day. The US Dollar gathers strength and weighs on the pair as investors seek refuge in the wake of Israel and the United States' joint attack on Iran.

GBP/USD targets 1.3500 barrier near moving averages

GBP/USD rebounds from the daily losses, trading around 1.3450 during the Asian hours on Monday. The technical analysis of the daily chart indicates an ongoing bearish bias, as the pair trades within a descending channel pattern.

Gold surges on safe-haven demand, tests $5,400

Gold benefits from intense risk-aversion on Monday and climbs to the $5,400 region, setting a fresh monthly-high in the process. Tensions in the Middle East remain high as Israel and Hezbollah continue to exchange strikes following the US-Israel joint attack on Iran over the weekend.

Bitcoin on brink of breakdown amid US-Iran war

Bitcoin (BTC) remains under pressure near the key support level of $65,700. Trading at $66,400 at the time of writing on Monday, a breakdown below this critical level would suggest a deeper correction ahead.

The week ahead: Conflict in the Middle East jolts markets

Events in the Middle East are obviously dominating financial markets this morning. The Brent crude oil price is extending gains and is higher by more than 8%, stock futures are pointing lower and the gold price is higher by more than 2%. 

Pi Network Price Forecast: Core team offloads supply, weighing on PI recovery

Pi Network  hovers below $0.1700, broadly steady at press time on Monday, attempting a recovery after a 2% loss the previous day. Sunday’s decline aligned with nearly 49 million PI tokens offloaded by the Pi Foundation, implying a spike in supply pressure that capped the prevailing four-day recovery.