|

WTI Price Analysis: 200-HMA probes sellers around $52.00

  • WTI remains on the back foot around one week low.
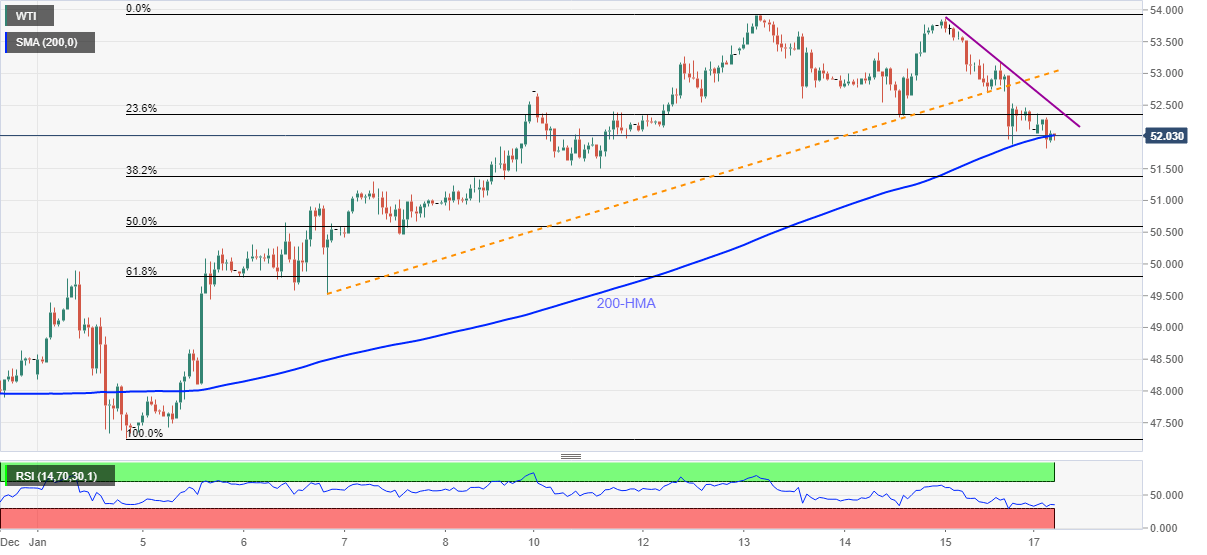
  • RSI conditions favor corrective pullback towards short-term resistance line.
  • Sellers may eye $51.30 as extra downside filter.

WTI wavers around $52.00, down 0.44% on a day, during early Monday. In doing so, the energy benchmark trades near the lowest level in one week as bears battle 200-HMA.

It should be noted that RSI conditions are also nearly oversold and can trigger the quote’s bounce. As a result, a downward sloping trend line from Friday, currently around $52.50, can lure intraday buyers.

However, any further upside will eye to refresh the multi-month high, marked earlier during the month, around $54.00.

During the rise, the black gold may avail an intermediate halt around $53.30 while February 2020 peak surrounding $54.70.

Alternatively, a sustained downside below 200-HMA level of $52.00 will eye for $51.00 and 61.8% Fibonacci retracement of January 04-13 upside, near $49.80.

Overall, WTI is in an uptrend but the intermediate pullbacks can’t be ruled out.

WTI hourly chart

Trend: Pullback expected

Additional important levels

Overview
Today last price51.99
Today Daily Change-0.25
Today Daily Change %-0.48%
Today daily open52.24
 
Trends
Daily SMA2049.8
Daily SMA5046.68
Daily SMA10043.14
Daily SMA20039.28
 
Levels
Previous Daily High53.86
Previous Daily Low51.89
Previous Weekly High53.94
Previous Weekly Low51.51
Previous Monthly High49.43
Previous Monthly Low44.01
Daily Fibonacci 38.2%52.64
Daily Fibonacci 61.8%53.11
Daily Pivot Point S151.47
Daily Pivot Point S250.69
Daily Pivot Point S349.5
Daily Pivot Point R153.44
Daily Pivot Point R254.64
Daily Pivot Point R355.41

Author

Anil Panchal

Anil Panchal

FXStreet

Anil Panchal has nearly 15 years of experience in tracking financial markets. With a keen interest in macroeconomics, Anil aptly tracks global news/updates and stays well-informed about the global financial moves and their implications.

More from Anil Panchal
Share:

Markets move fast. We move first.

Orange Juice Newsletter brings you expert driven insights - not headlines. Every day on your inbox.

By subscribing you agree to our Terms and conditions.

Editor's Picks

EUR/USD recovers to 1.1750 region as 2025 draws to a close

Following the bearish action seen in the European session on Wednesday, EUR/USD regains its traction and recovery to the 1.1750 region. Nevertheless, the pair's volatility remains low as trading conditions thin out on the last day of the year.

GBP/USD stays weak near 1.3450 on modest USD recovery

GBP/USD remains under modest beairsh pressure and fluctuates at around 1.3450 on Wednesday. The US Dollar finds fresh demand due to the end-of-the-year position adjustments, weighing on the pair amid the pre-New Year trading lull. 

Gold retreats to $4,300 area, looks to post monthly gains

Gold stays on the back foot on the last day of 2025 and trades near $4,300, possibly pressured by profit-taking and position adjustments. Nevertheless, XAU/USD remains on track to post gains for December and extend its winning streak into a fifth consecutive month.

Bitcoin, Ethereum and XRP prepare for a potential New Year rebound

Bitcoin, Ethereum, and Ripple are holding steady on Wednesday after recording minor gains on the previous day. Technically, Bitcoin could extend gains within a triangle pattern while Ethereum and Ripple face critical overhead resistance. 

Economic outlook 2026-2027 in advanced countries: Solidity test

After a year marked by global economic resilience and ending on a note of optimism, 2026 looks promising and could be a year of solid economic performance. In our baseline scenario, we expect most of the supportive factors at work in 2025 to continue to play a role in 2026.

Crypto market outlook for 2026

Year 2025 was volatile, as crypto often is.  Among positive catalysts were favourable regulatory changes in the U.S., rise of Digital Asset Treasuries (DAT), adoption of AI and tokenization of Real-World-Assets (RWA).