|

WTI Price Analysis: 100-SMA challenges further downside

  • WTI bears take a breather after reversing from October 2018 tops.
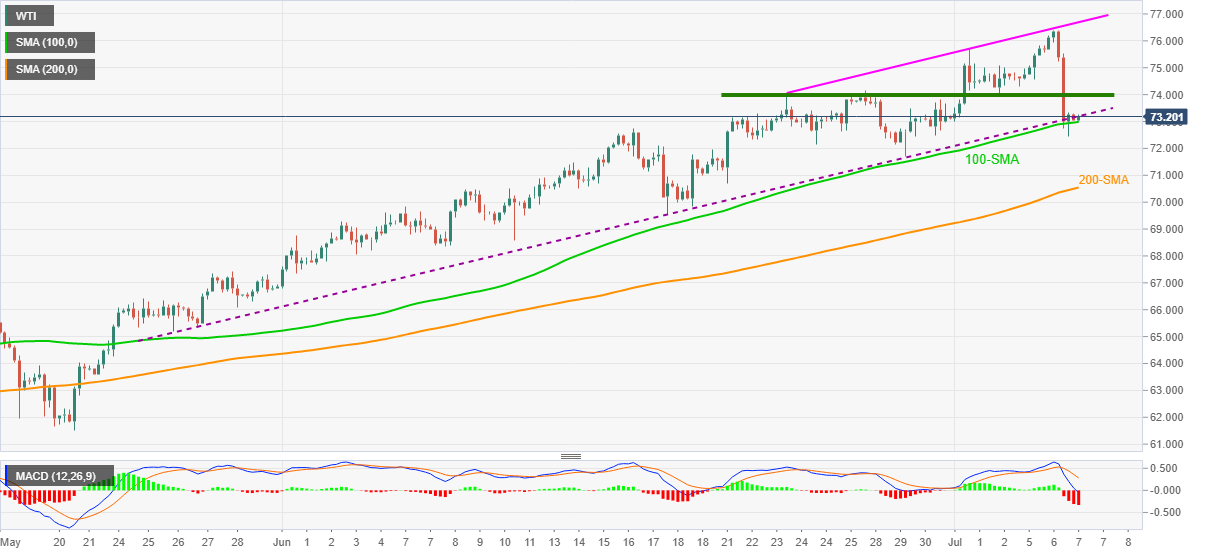
  • Bearish MACD, trend line break keep sellers hopeful.
  • Bulls need to cross $74.00 to retake the controls.

WTI oil prices remain pressured, despite a recent bounce off the one-week low, down 0.12% around $73.20, amid Wednesday’s Asian session. The black gold refreshed the highest levels since October 2018 the previous day, before declining the most in three months.

The commodity’s slump broke an ascending support line from late May, also ticked below 100-SMA, but couldn’t stay low for longer. That said, the quote seems to hold the immediate SMA support of late.

That said, the energy benchmark struggles between 100-SMA and the previous support line, respectively around $73.00 and $73.25. Even so, bearish MACD and the sustained break of the stated support line back the bears to aim for a 200-SMA level of $70.55.

It should, however, be noted that the quote needs a clear downside break of the mid-June tops surrounding $72.20, not to forget the break of 100-SMA level of $73.00, to extend the fall towards the key SMA. Following that, the $70.00 threshold and June 17 lows near $69.55 will be in focus.

On the flip side, a clear break of $72.25 will trigger a corrective pullback targeting the two-week-old horizontal area near $74.00.

Though, any further upside will not hesitate to refresh the multi-month high of $76.40 but will be tested by an ascending resistance line from June 23, close to $76.70.

WTI: Four-hour chart

Trend: Pullback expected 

Additional important levels

Overview
Today last price73.27
Today Daily Change-0.04
Today Daily Change %-0.05%
Today daily open73.31
 
Trends
Daily SMA2072.47
Daily SMA5068.49
Daily SMA10065.12
Daily SMA20055.71
 
Levels
Previous Daily High76.4
Previous Daily Low72.44
Previous Weekly High75.7
Previous Weekly Low71.69
Previous Monthly High74.17
Previous Monthly Low66.78
Daily Fibonacci 38.2%73.96
Daily Fibonacci 61.8%74.89
Daily Pivot Point S171.7
Daily Pivot Point S270.09
Daily Pivot Point S367.74
Daily Pivot Point R175.66
Daily Pivot Point R278.01
Daily Pivot Point R379.62

Author

Anil Panchal

Anil Panchal

FXStreet

Anil Panchal has nearly 15 years of experience in tracking financial markets. With a keen interest in macroeconomics, Anil aptly tracks global news/updates and stays well-informed about the global financial moves and their implications.

More from Anil Panchal
Share:

Editor's Picks

EUR/USD recedes to daily lows near 1.1850

EUR/USD keeps its bearish momentum well in place, slipping back to the area of 1.1850 to hit daily lows on Monday. The pair’s continuation of the leg lower comes amid decent gains in the US Dollar in a context of scarce volatility and thin trade conditions due to the inactivity in the US markets.

GBP/USD resumes the downtrend, back to the low-1.3600s

GBP/USD rapidly leaves behind Friday’s decent advance, refocusing on the downside and retreating to the 1.3630 region at the beginning of the week. In the meantime, the British Pound is expected to remain under the microscope ahead of the release of the key UK labour market report on Tuesday.

Gold looks inconclusive around $5,000

Gold partially fades Friday’s strong recovery, orbiting around the key $5,000 region per troy ounce in a context of humble gains in the Greenback on Monday. Additing to the vacillating mood, trade conditions remain thin amid the observance of the Presidents Day holiday in the US.

Bitcoin consolidates as on-chain data show mixed signals

Bitcoin price has consolidated between $65,700 and $72,000 over the past nine days, with no clear directional bias. US-listed spot ETFs recorded a $359.91 million weekly outflow, marking the fourth consecutive week of withdrawals.

The week ahead: Key inflation readings and why the AI trade could be overdone

It is likely to be a quiet start to the week, with US markets closed on Monday for Presidents Day. European markets are higher across the board and gold is clinging to the $5,000 level after the tamer than expected CPI report in the US reduced haven flows to precious metals.

Monero Price Forecast: XMR risks a drop below $300 under mounting bearish pressure

Monero (XMR) starts the week under pressure, recording a 4% decline at press time on Monday after a 7% drop the previous day, putting the $300 support zone in focus.