|

WTI Price Analysis: 100-hour SMA is capping upside

West Texas Intermediate (WTI) crude is currently trading near $65 per barrel. 

Oil broke higher from the hourly chart bearish channel during Wednesday's US trading hours. So far, however, the breakout has failed to invite stronger buying pressure, leaving the 100-hour Simple Moving Average (SMA) hurdle intact. 

The SMA is currently lined up at $65.06. The average proved a tough nut to crack on Wednesday. 

A convincing move above the SMA would revive the immediate bullish view, opening the doors for a retest of the March 8 high of $67.98. 

Meanwhile, acceptance under the 200-hour SMA located at $63.15 would shift risk in favor of a deeper correction. 

Hourly chart

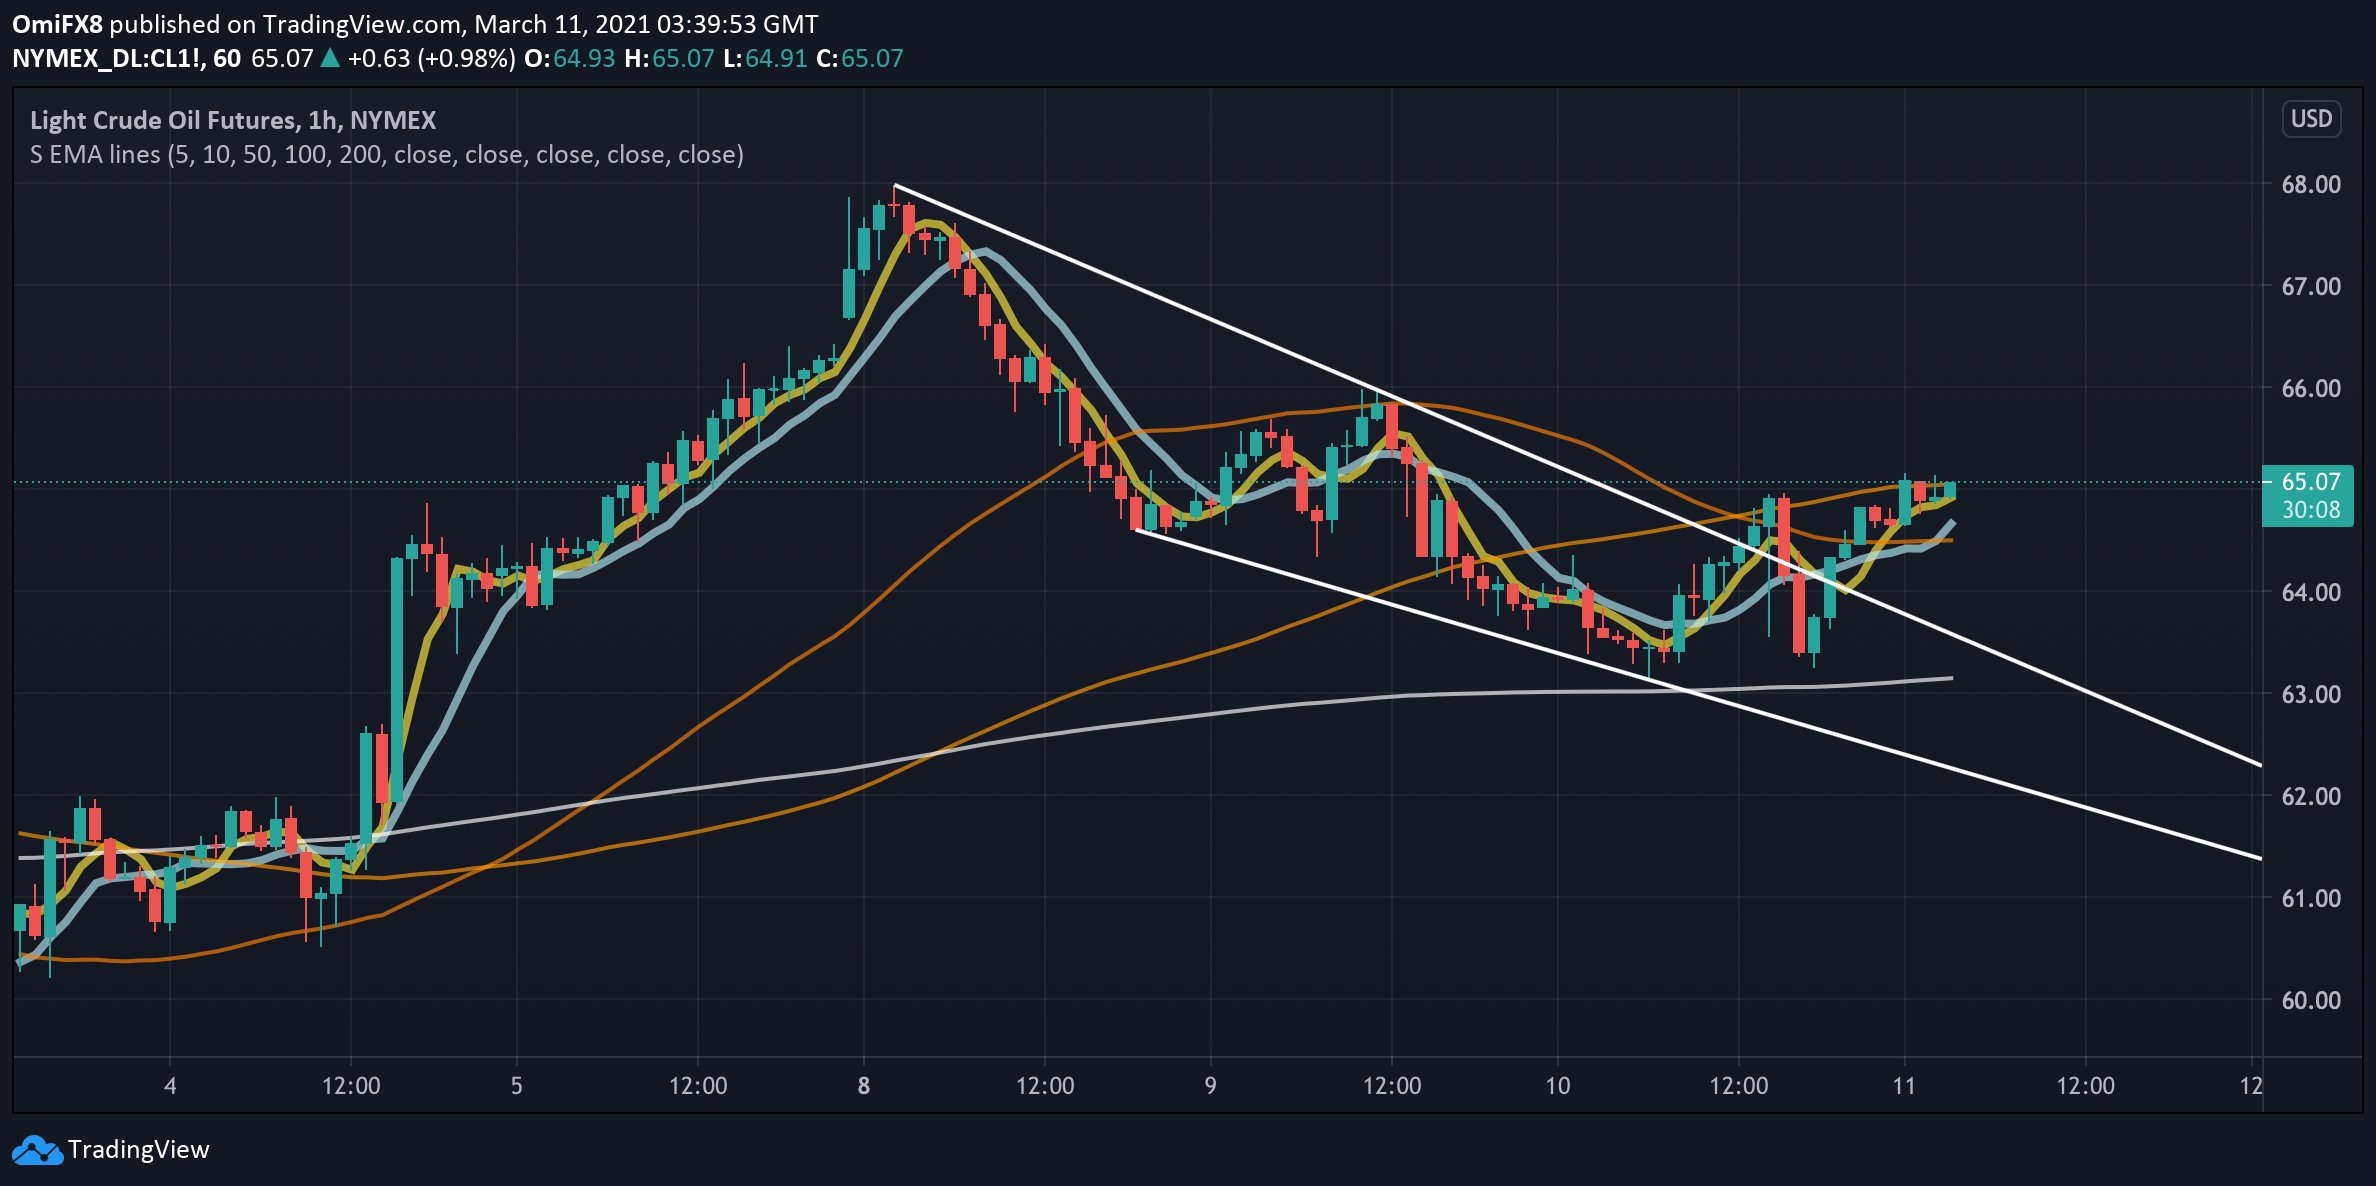
Trend: Bullish above 100-hour SMA

Technical levels

WTI

Overview
Today last price65.04
Today Daily Change0.26
Today Daily Change %0.40
Today daily open64.78
 
Trends
Daily SMA2061.69
Daily SMA5056.47
Daily SMA10050.04
Daily SMA20045.23
 
Levels
Previous Daily High64.91
Previous Daily Low63.11
Previous Weekly High66.27
Previous Weekly Low59.17
Previous Monthly High63.72
Previous Monthly Low51.6
Daily Fibonacci 38.2%64.22
Daily Fibonacci 61.8%63.8
Daily Pivot Point S163.63
Daily Pivot Point S262.47
Daily Pivot Point S361.82
Daily Pivot Point R165.43
Daily Pivot Point R266.07
Daily Pivot Point R367.23

Author

Omkar Godbole

Omkar Godbole

FXStreet Contributor

Omkar Godbole, editor and analyst, joined FXStreet after four years as a research analyst at several Indian brokerage companies.

More from Omkar Godbole
Share:

Markets move fast. We move first.

Orange Juice Newsletter brings you expert driven insights - not headlines. Every day on your inbox.

By subscribing you agree to our Terms and conditions.

Editor's Picks

EUR/USD falls toward 1.1700 on broad USD recovery

EUR/USD turns south and declines toward 1.1700 on Wednesday. The US Dollar gathers recovery momentum and forces the pair to stay on the back foor, as traders look to USD short-covering ahead of US inflation report on Thursday. However, the downside could be capped by hawkish ECB expectations. 

GBP/USD trades deep in red below 1.3350 after soft UK inflation data

GBP/USD stays under strong selling pressure midweek and trades below 1.3350. The UK annual headline and core CPI rose by 3.2% each, missing estimates of 3.5% and 3.4%, respectively, reaffirming dovish BoE expectations and smashing the Pound Sterling across the board ahead of Thurday's BoE policy announcements. 

Gold clings to moderate daily gains above $4,300

Following Tuesday's volatile action, Gold regains its traction on Wednesday and trades in positive territory above $4,300. While the buildup in the USD recovery momentum caps XAU/USD's upside, the cautious market stance helps the pair hold its ground.

Bitcoin risks deeper correction as ETF outflows mount, derivative traders stay on the sidelines

Bitcoin (BTC) remains under pressure, trading below $87,000 on Wednesday, nearing a key support level. A decisive daily close below this zone could open the door to a deeper correction.

Monetary policy: Three central banks, three decisions, the same caution

While the Fed eased its monetary policy on 10 December for the third consecutive FOMC meeting, without making any guarantees about future action, the BoE, the ECB and the BoJ are holding their respective meetings this week. 

AAVE slips below $186 as bearish signals outweigh the SEC investigation closure

Aave (AAVE) price continues its decline, trading below $186 at the time of writing on Wednesday after a rejection at the key resistance zone. Derivatives positioning and momentum indicators suggest that bearish forces still dominate in the near term.