|

WTI plunges below $70.00 in upbeat US inventory report, China’s economy concerns

  • WTI slides more than 3% after a rise in US gasoline stockpiles.
  • Crude Oil inventories fall by 4.6 million barrels, surpassing forecasts; market sentiment shifts to demand concerns over supply.
  • OPEC+ voluntary production cut of 2.2 million barrels for Q1 2024; Saudi Arabia and Russia hint at potential extension beyond March.

The US crude oil benchmark dropped below $70.00 per barrel after a solid inventory report in the United States (US) concerned market participants, outweighing the drawdown in crude stocks. WTI is trading at $69.52, down more than 3%.

WTI at $69.52, down over 3% as robust US inventory report amplifies demand worries; China's economic outlook adds pressure

The US Energy Information Administration (EIA) revealed that US gasoline stockpiles rose by 5.4 million barrels last week, five times the 1 million fall expected by market analysts. Consequently, Crude Oil inventories fell by 4.6 million barrels, exceeding the 1.4 million foreseen.

Sources cited by Reuters said, “There is demand destruction coming in from the fuel side. The market is more demand focused than supply-focused right now.”

Last week, the Organization of Petroleum Exporting Countries and its allies, OPEC+, agreed to take a voluntary production cut of 2.2 million barrels for the first quarter of 2024. During the current week, Saudi Arabia and Russian officials commented that cuts could be extended beyond March.

Oil prices remain on the defensive, spurred by China’s economic recovery as concerns mount, a day after rating agency Moody’s lowered the outlook on China’s A1 rating to negative from stable. In the meantime, further data from China would be revealed, with Oil traders eyeing the release of the Balance of Trade.

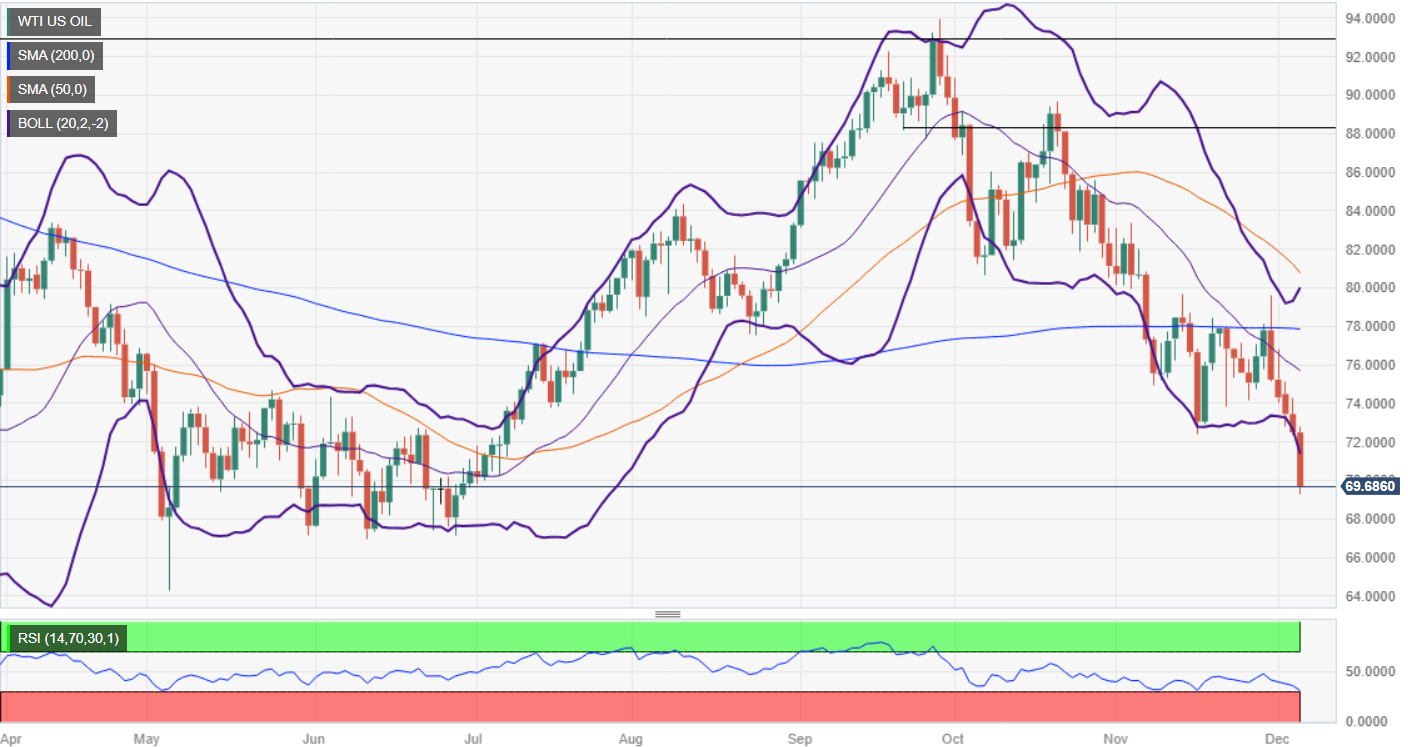
WTI Price Analysis: Technical outlook

The daily chart portrays WTI in a downtrend, with bears in full control, after breaching last year’s low of $70.10, which has opened the door for further downside. The next demand area would be the June 28 daily low at $67.10, followed by the latest swing low of $66.85, the June 12 daily low. If those levels are taken out, that will expose the year-to-date (YTD) low of $63.61. On the flipside, if buyers reclaim the $70.00 barrier, that could pave the way to test the November 16 daily low of $72.22.

WTI US OIL

Overview
Today last price69.58
Today Daily Change-2.91
Today Daily Change %-4.01
Today daily open72.49
 
Trends
Daily SMA2075.99
Daily SMA5081.23
Daily SMA10082.21
Daily SMA20077.89
 
Levels
Previous Daily High74.26
Previous Daily Low72.35
Previous Weekly High79.62
Previous Weekly Low74.04
Previous Monthly High83.34
Previous Monthly Low72.39
Daily Fibonacci 38.2%73.08
Daily Fibonacci 61.8%73.53
Daily Pivot Point S171.81
Daily Pivot Point S271.13
Daily Pivot Point S369.91
Daily Pivot Point R173.72
Daily Pivot Point R274.94
Daily Pivot Point R375.62

Author

Christian Borjon Valencia

Markets analyst, news editor, and trading instructor with over 14 years of experience across FX, commodities, US equity indices, and global macro markets.

More from Christian Borjon Valencia
Share:

Editor's Picks

AUD/USD eyes 0.7150 barrier nine-day EMA

AUD/USD inches higher after registering modest losses in the previous day, trading around 0.7130 during the Asian hours. The technical analysis of the daily chart indicates that the pair is moving sideways within the rectangle pattern, suggesting a consolidation as neither the bulls nor the bears have enough momentum to take control of the market.

USD/JPY trades below 160.00 intervention threshold; bullish bias intact

The USD/JPY pair attracts some sellers during the Asian session amid fears that authorities will step in again to prop up the Japanese Yen. Furthermore, the Israel-Lebanon truce prompts some profit-taking around the US Dollar and exerts downward pressure on the currency pair.

Gold defends 200-day SMA at $4,425, but for how long?

Gold is attempting a tepid recovery toward $4,500 early Thursday, as renewed optimism in the Mideast geopolitical front calms market nerves. This cautious optimism across Asian markets weighs on Oil prices, and diminishes the US Dollar’s safe-haven appeal, helping Gold stage a decent comeback from the weekly low of $4,424.


Hyperliquid: ETF demand, capital rotation fuel HYPE rally as Bitcoin melts

Hyperliquid price sustains an upward trend near its all-time high of $75.76 on Thursday after posting 80% gains in May, while Bitcoin (BTC) retraces below $65,000, triggering a market-wide panic.

Kevin Warsh takes the Fed helm: What it means for the US Dollar
The Federal Reserve moves away from the highly predictable "forward guidance" model of the Jerome Powell era to a new “Kevin Warsh environment”, characterized by less communication, more policy surprises, and an increased focus on the Fed's complex balance sheet.
Recession on paper: What really moves the Canadian Loonie now?

Statistics Canada handed the headline writers a gift and the analysts a headache. Real GDP shrank 0.1% on an annualized basis in the first quarter, and with the fourth quarter of 2025 revised down to a 1.0% contraction, that is two negative quarters in a row, the textbook definition of a technical recession and Canada's first since the pandemic.