WTI Oil Price Analysis: Closing in on cluster of resistance in the $79.00s


  • Oil is rising up to a cluster of daily major moving averages in the $79.00s. 
  • These will probably present a tough level of resistance for the commodity. 
  • The persistence of the short-term uptrend will depend on a decisive break of this resistance barrier. 

WTI Oil is trading in the $78.50s during the US session on Friday. 

On the 4-hour chart used to assess the short-term trend Oil has decisively broken out a falling channel and reached the conservative target for the breakout at $78.17 (Fibonacci 0.618 extension of the width of the channel extrapolated higher).  

Oil 4-Hour Chart 

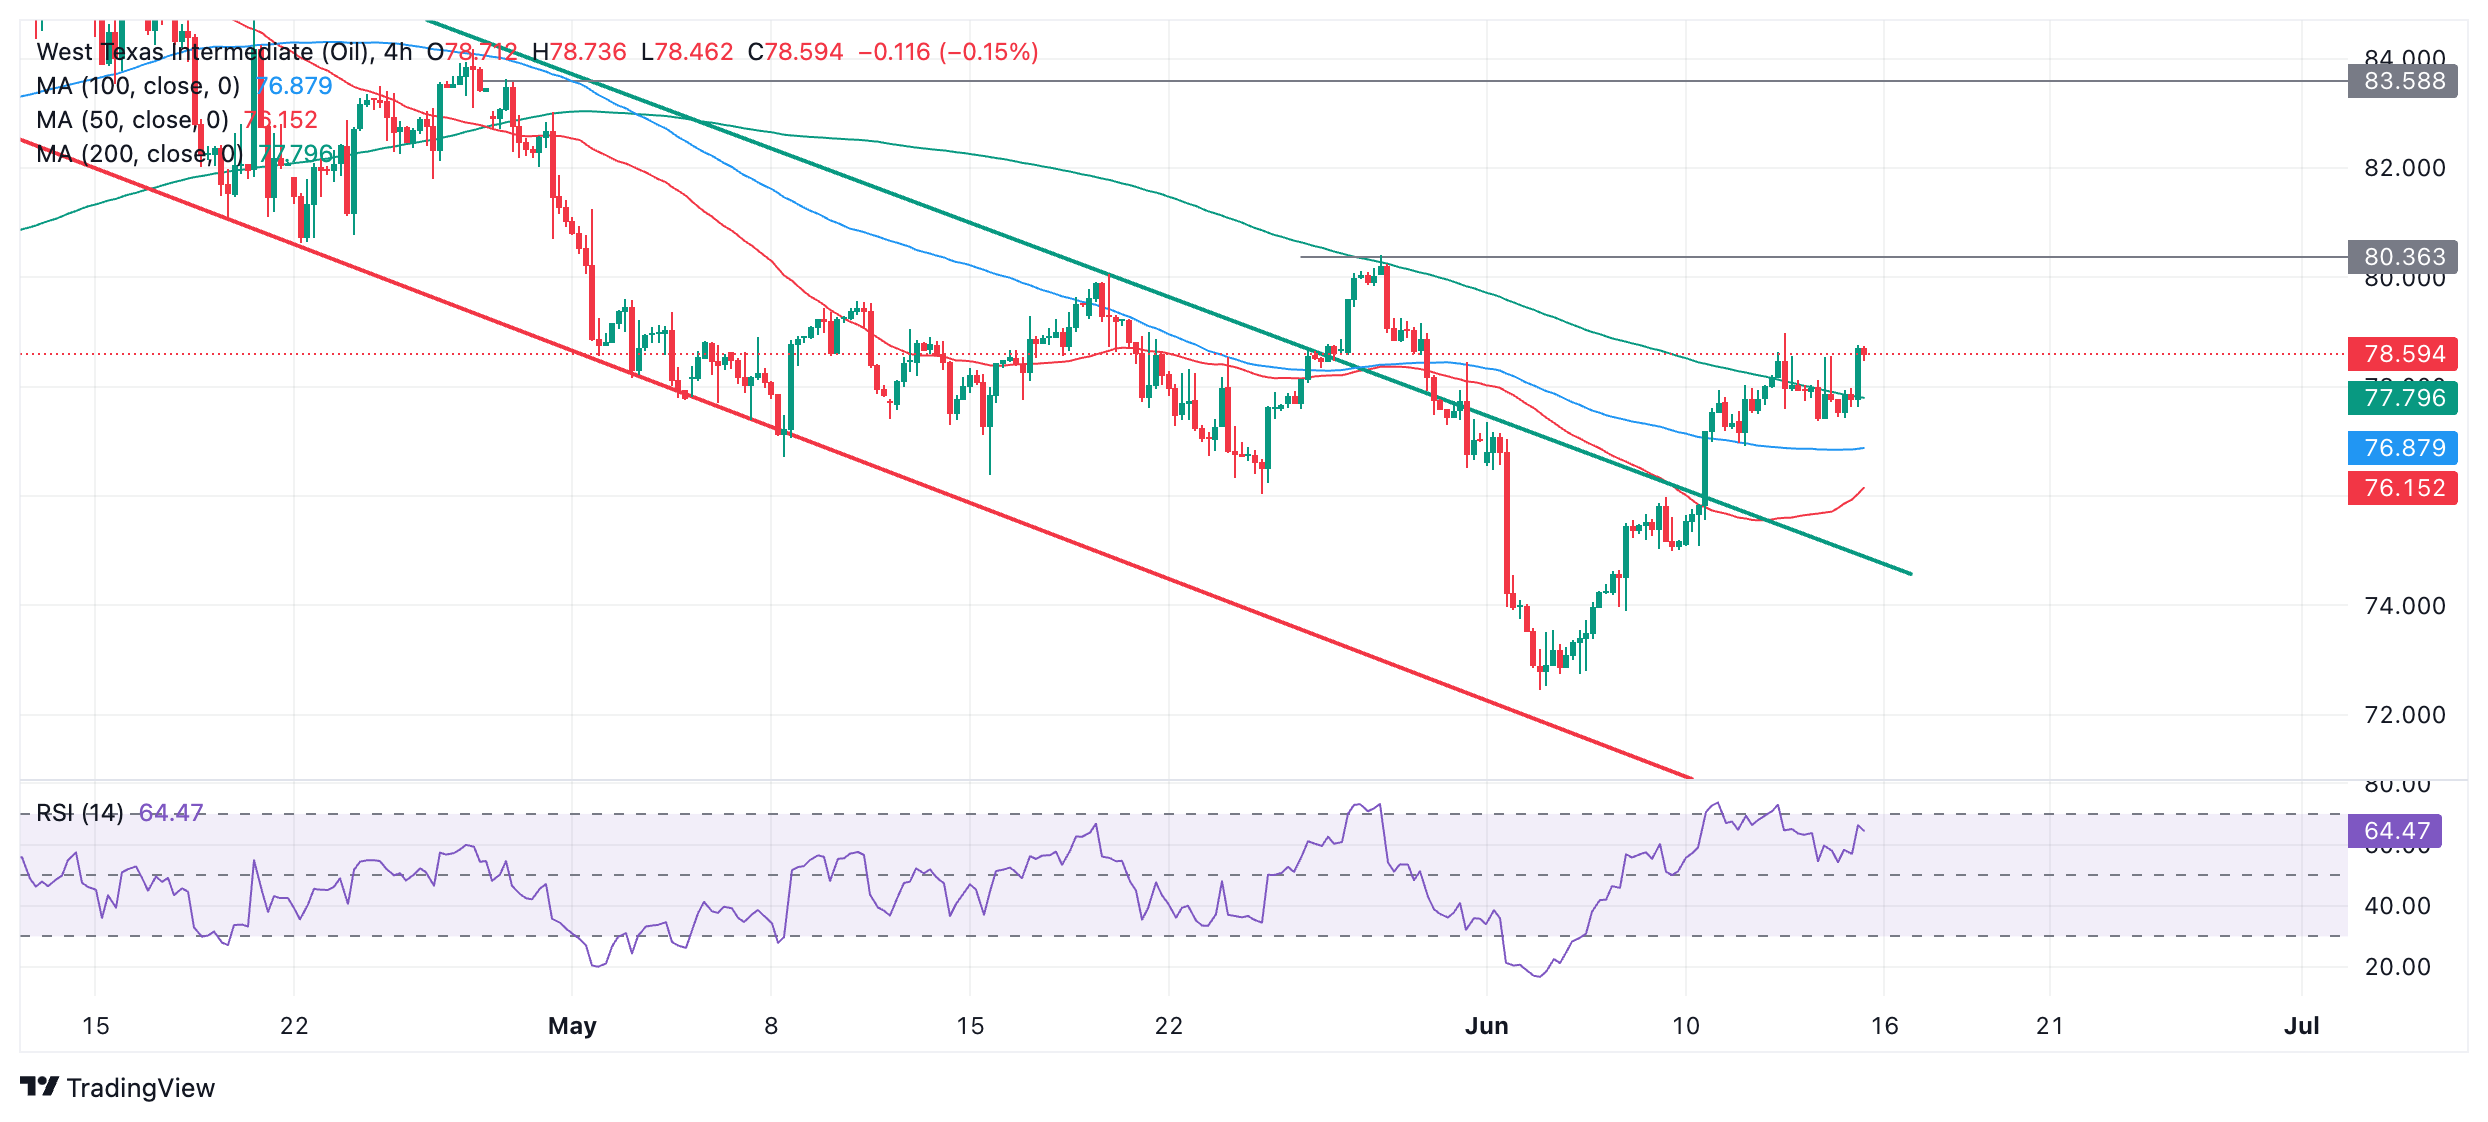
Since breaking out of the channel, Oil is probably now in a short-term uptrend with the odds favoring more upside in the short-term, given “the trend is your friend”. However, it has now reached its initial target so is vulnerable to a pullback. 

A breakout above the last lower high of the prior downtrend at $80.36 (May 29 high) would provide added bullish confirmation and extend the uptrend higher. Such a move might be expected to reach the next key target at $83.50 (April 29 high and top of chart gap). 

The direction of Oil is less clear on the daily chart used to assess the intermediate term trend. 

Oil Daily Chart

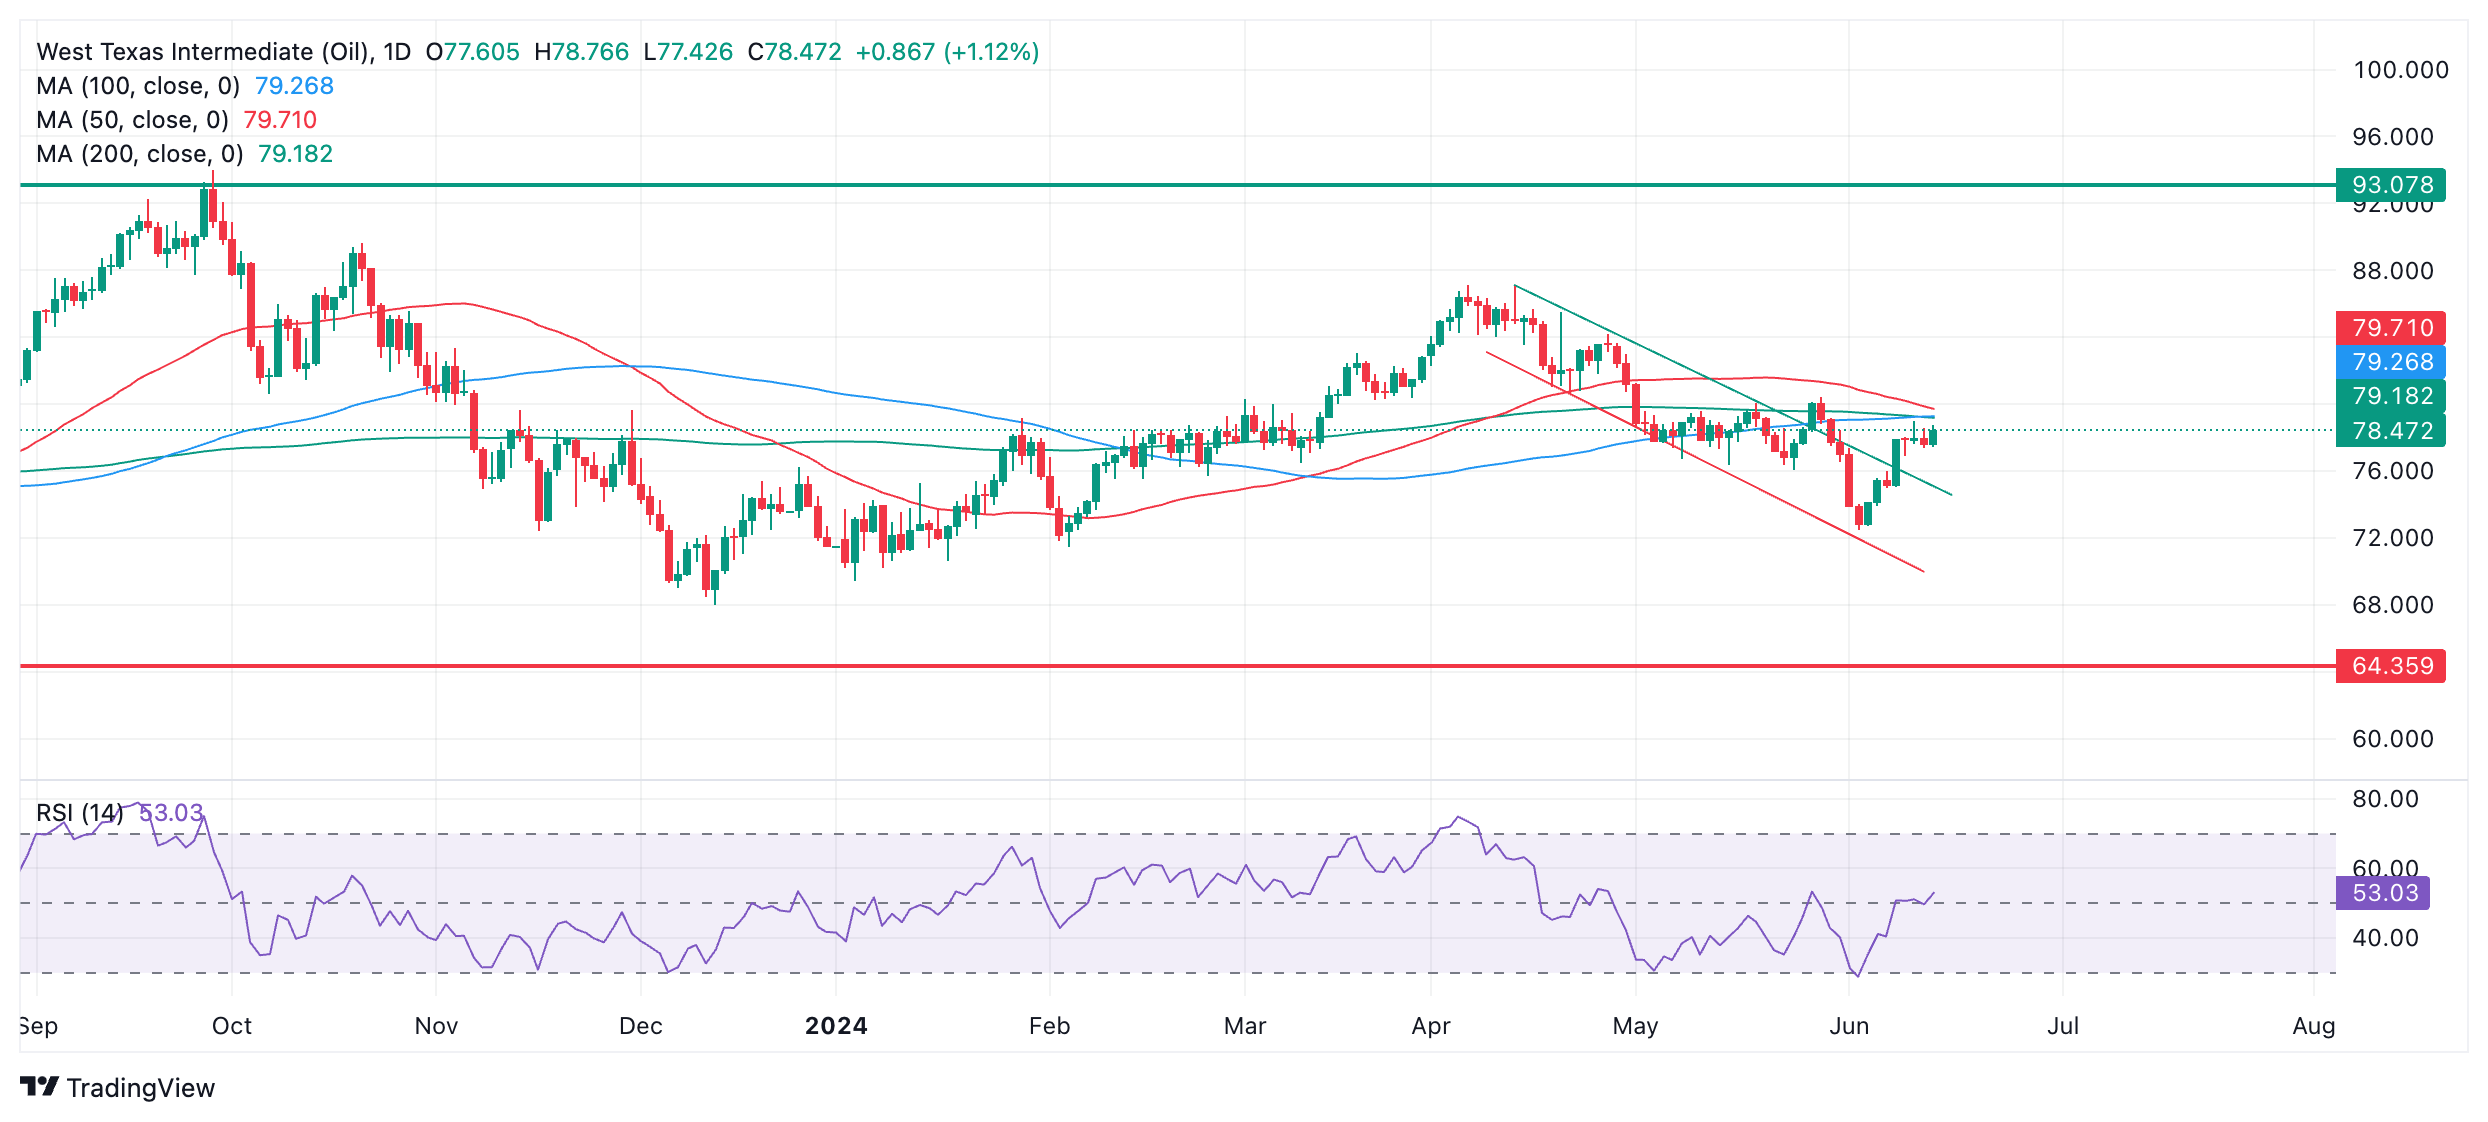
The key feature on the daily chart is the cluster of resistance in the $79s from all three major Simple Moving Averages (SMA) – the 50, 100 and 200-day SMAs. This is likely to present a considerable barrier to more upside and could be an inflection point for Oil price. 

It would require a close on a daily basis above $80.36 (May 29 high) to confirm a successful break above resistance from the three SMAs and a continuation up to a target at $83.50. 

WTI Oil appears to be trading within a broad long-term range between $64.00 and $93.00 on the weekly chart. This suggests the long-term trend is probably sideways. 

Oil Weekly Chart

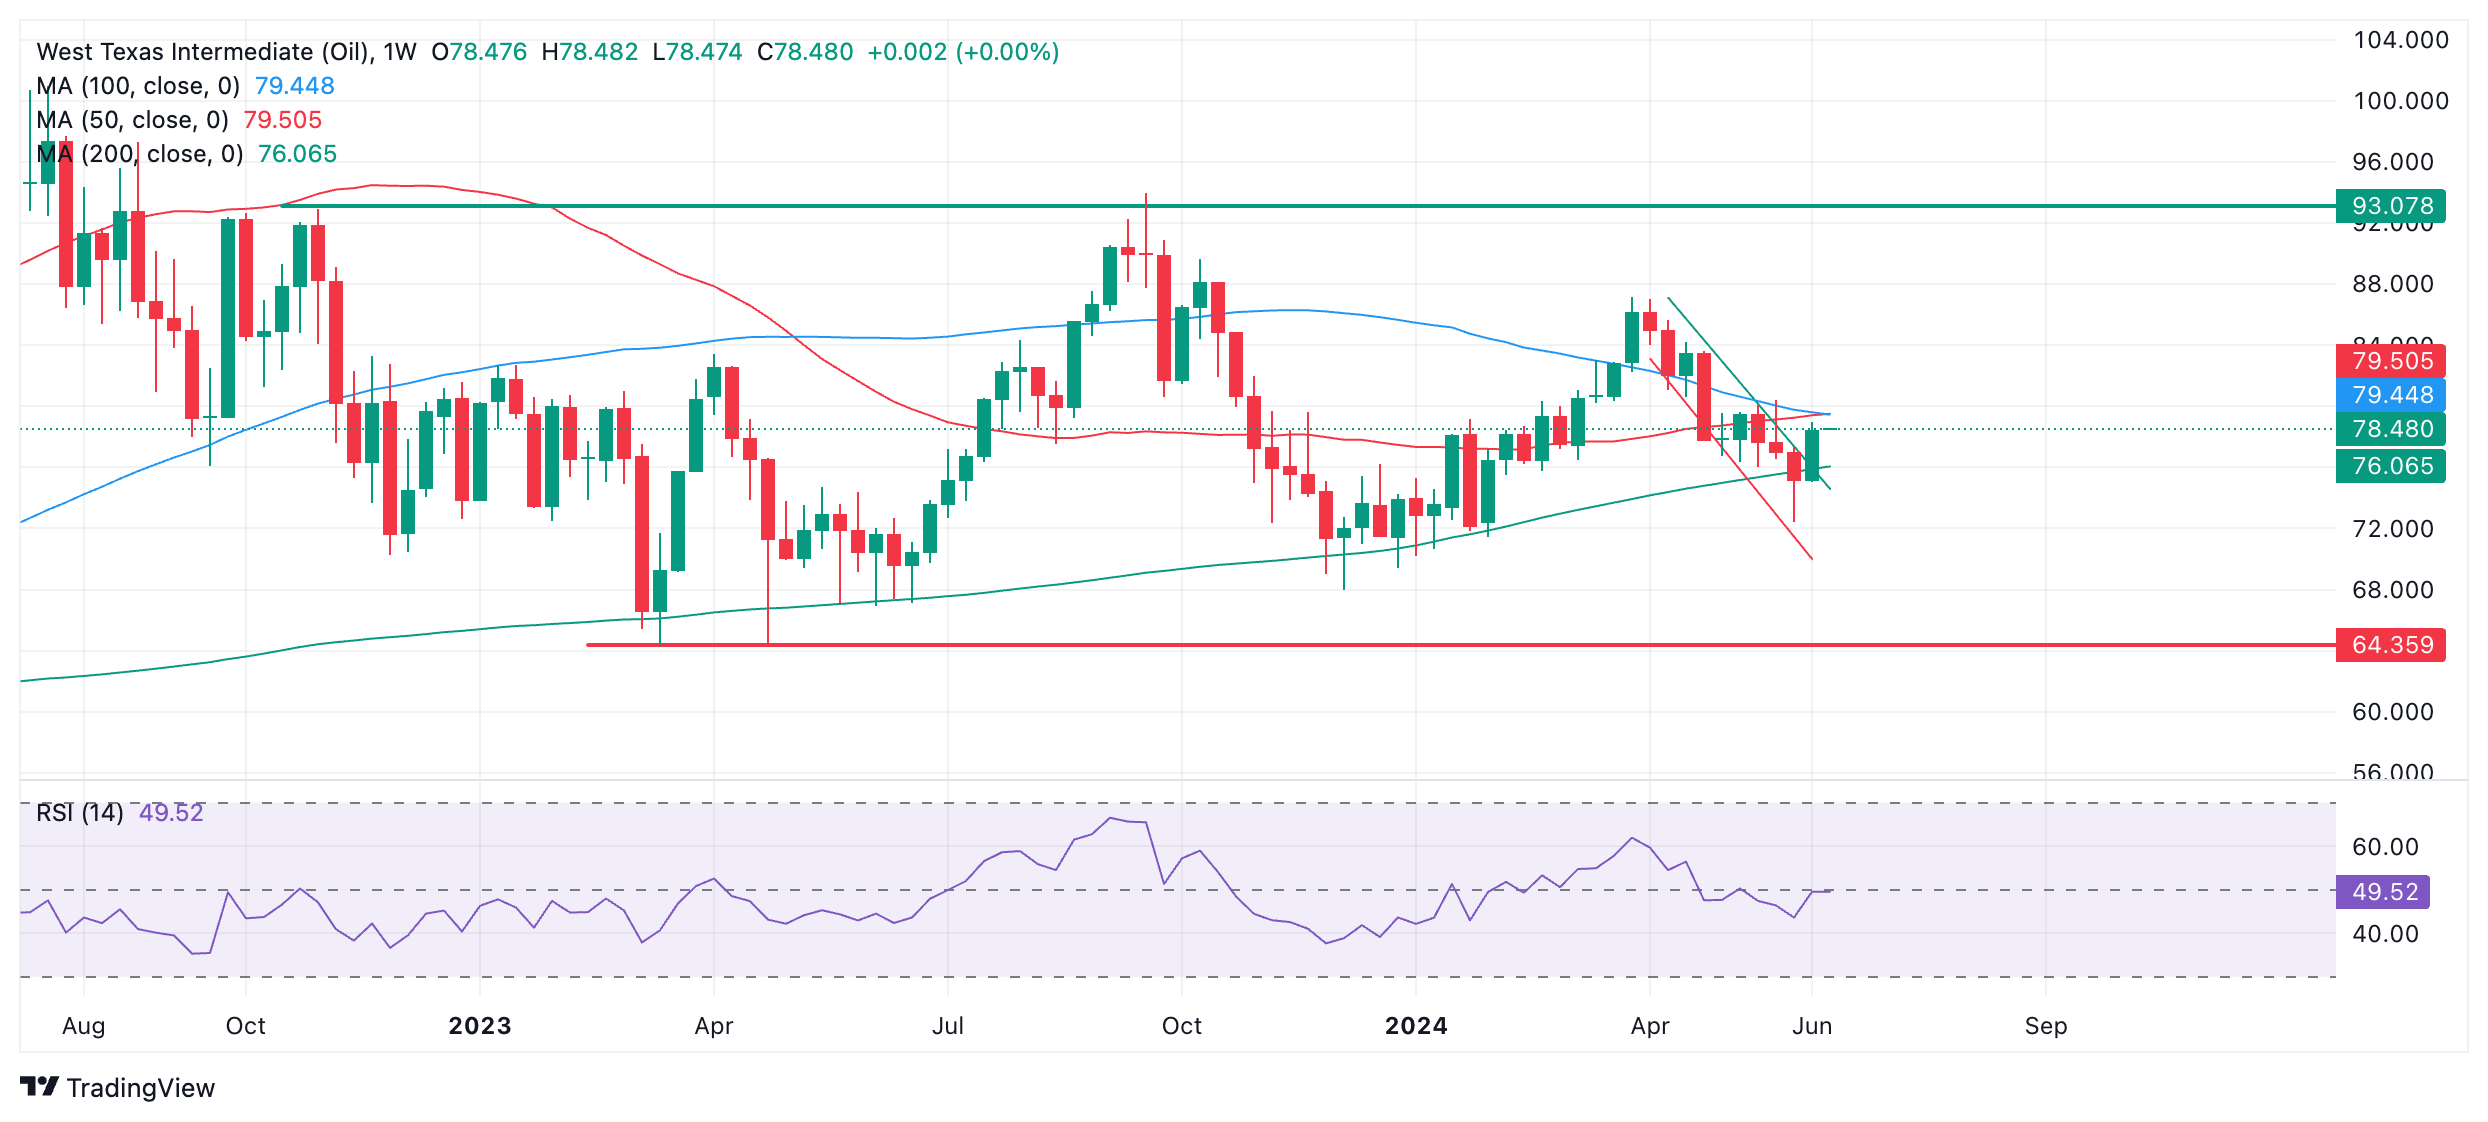
Last week’s red club-shaped candlestick could be a sign the move down has completed and Oil price may be reversing. Similarly-shaped candlesticks often punctuate the end of down moves in asset prices. It is possible Oil price could be about to begin a bullish sequence higher. 

The 200-week SMA has acted as reliable support on multiple occasions in 2023-24 and is providing support again at the current week’s lows. The reliability of the 200-week SMA further enhances the case for a bullish reversal. 


Share: Feed news

Information on these pages contains forward-looking statements that involve risks and uncertainties. Markets and instruments profiled on this page are for informational purposes only and should not in any way come across as a recommendation to buy or sell in these assets. You should do your own thorough research before making any investment decisions. FXStreet does not in any way guarantee that this information is free from mistakes, errors, or material misstatements. It also does not guarantee that this information is of a timely nature. Investing in Open Markets involves a great deal of risk, including the loss of all or a portion of your investment, as well as emotional distress. All risks, losses and costs associated with investing, including total loss of principal, are your responsibility. The views and opinions expressed in this article are those of the authors and do not necessarily reflect the official policy or position of FXStreet nor its advertisers. The author will not be held responsible for information that is found at the end of links posted on this page.

If not otherwise explicitly mentioned in the body of the article, at the time of writing, the author has no position in any stock mentioned in this article and no business relationship with any company mentioned. The author has not received compensation for writing this article, other than from FXStreet.

FXStreet and the author do not provide personalized recommendations. The author makes no representations as to the accuracy, completeness, or suitability of this information. FXStreet and the author will not be liable for any errors, omissions or any losses, injuries or damages arising from this information and its display or use. Errors and omissions excepted.

The author and FXStreet are not registered investment advisors and nothing in this article is intended to be investment advice.

Recommended content


Recommended content

Editors’ Picks

EUR/USD struggles to retain 1.1500 as USD gains traction

EUR/USD struggles to retain 1.1500 as USD gains traction

EUR/USD hovers around the 1.1500 level in the American session on Friday. The US Dollar surges despite dovish comments from Fed Governor Waller, supporting a rate cut as soon as July. The mood sours as investors weigh Middle East developments. 

GBP/USD dives below 1.3500 after weak UK data, resurgent USD

GBP/USD dives below 1.3500 after weak UK data, resurgent USD

GBP/USD turned red for the day and approaches the 1.3450 area as the week comes to an end. Earlier in the day, the UK reported weak Retail Sales figures, although the ongoing slump seems related to renewed risk aversion fueling safe-haven US Dollar demand. 


Gold surges above $3,3360 as fears kick in

Gold surges above $3,3360 as fears kick in

Gold gathers near-term momentum and trades near $3,370 ahead of the weekly close, as risk sentiment took a turn to the south. Following a positive start, Wall Street turned south. Middle East tensions and massive back-and-forth missile exchanges between Iran and Israel seem to be behind the ongoing run to safety.


Ripple Price Prediction: How tokenized treasuries could accelerate XRP to $10 by end-2025

Ripple Price Prediction: How tokenized treasuries could accelerate XRP to $10 by end-2025

Ondo Finance launched tokenized treasuries on the XRP Ledger in June, paving the way for seamless institutional adoption. The market capitalization of tokenized treasuries has grown to $5.9 billion despite market uncertainty over US tariffs.

Weekly focus: War and risk of escalation weigh on market sentiment

Weekly focus: War and risk of escalation weigh on market sentiment

The war between Israel and Iran and the risk of further escalation weighed on markets this week. Equity markets largely traded in red and US treasury yields slid lower. That said, markets were by no means in full risk-off sentiment.

The Best brokers to trade EUR/USD

The Best brokers to trade EUR/USD

SPONSORED Discover the top brokers for trading EUR/USD in 2025. Our list features brokers with competitive spreads, fast execution, and powerful platforms. Whether you're a beginner or an expert, find the right partner to navigate the dynamic Forex market.

Forex MAJORS

Cryptocurrencies

Signatures

Best Brokers of 2025