|

WTI giving back some of Thursday's gains, tests below $88.00

  • Crude Oil prices are seeing a tentative step back after tipping into a 13-day high early on Friday.
  • WTI tested back into the $88.00 handle, but plenty of bidding strength remains as markets weigh geopolitical concerns.
  • Bidding interest remains high in Crude Oil, and downside moves will face continued upside pressure.

West Texas Intermediary (WTI) Crude Oil prices are on the lower side for Friday, albeit slightly as ongoing geopolitical tensions in the Gaza Strip threaten to spill over and global production continues to flub barrel demand.

Thursday's run up the charts in spot Crude prices saw a mild extension into early Friday, sending WTI into $89.64 to retest its highest bids in almost three trading weeks before a relief pullback pinged just south of $88.00 per barrel.

Price action is now firming up in the midrange with Crude Oil bids testing back and forth near the $88.00 neighborhood as energies traders weigh their options heading into the weekend market close.

Geopolitical tensions between Israel and Hamas continue to weigh on oil markets as investors fret over a potential spillover that could destabilize the region near the Strait of Hormuz; while Israel and Palestine are not major players in Crude Oil markets, the nearby Strait of Hormuz is a key chokepoint for global oil supply, seeing a fifth of all oil supply pass through its waters.

It was revealed this week that the US is set to lift sanctions on Venezuelan crude oil exports in a bid to prop up woefully under-supplied global oil markets, which took WTI lower in the mid-week, but Venezuelan oil producers remain drastically below capacity, and it will take some time for Venezuelan barrels to begin eating away at undersupply.

WTI Technical Outlook

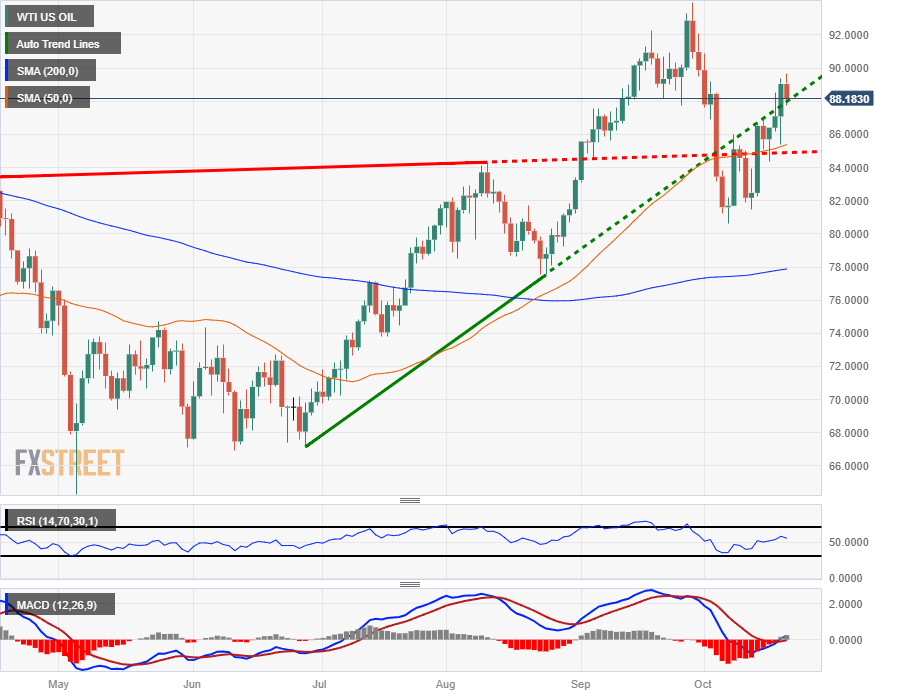
Crude Oil has continued a healthy rebound from October's early dip into $80.63, with WTI bids still up around 9% from the month's early swing low, and a bullish continuation will pave the way for a run at September's high bids near $94.00.

The downside is getting capped off by the 50-day Simple Moving Average, currently pushing higher from just south of $86.00, and daily candlesticks have so far been unwilling to push too far past the technical barrier, with the 200-day SMA rolling over into a bullish stance from $78.00

WTI Daily Chart

WTI Technical Levels

WTI US OIL

Overview
Today last price88.51
Today Daily Change-0.53
Today Daily Change %-0.60
Today daily open89.04
 
Trends
Daily SMA2086.76
Daily SMA5085.27
Daily SMA10079.89
Daily SMA20077.83
 
Levels
Previous Daily High89.39
Previous Daily Low85.39
Previous Weekly High86.63
Previous Weekly Low81.45
Previous Monthly High93.98
Previous Monthly Low83.09
Daily Fibonacci 38.2%87.86
Daily Fibonacci 61.8%86.92
Daily Pivot Point S186.49
Daily Pivot Point S283.94
Daily Pivot Point S382.48
Daily Pivot Point R190.49
Daily Pivot Point R291.94
Daily Pivot Point R394.5

Author

Joshua Gibson

Joshua joins the FXStreet team as an Economics and Finance double major from Vancouver Island University with twelve years' experience as an independent trader focusing on technical analysis.

More from Joshua Gibson
Share:

Editor's Picks

EUR/USD loses ground below 1.1850 ahead of FOMC Minutes

The EUR/USD pair loses traction near 1.1840 during the early European session on Wednesday, pressured by renewed US Dollar demand. Traders brace for the Federal Open Market Committee Minutes for signals on future rate cuts, which will be released later on Wednesday. 

When is the UK CPI data and how could it affect GBP/USD?

The United Kingdom Consumer Price Index data for January is scheduled to be published today at 07:00 GMT. GBP/USD trades slightly lower at around 1.3556 as of writing. The 20-period Exponential Moving Average trends lower at 1.3593 and continues to cap rebounds. Price holds beneath this gauge, maintaining a short-term bearish bias.

Gold: Is the $5,000 level back in sight?

Gold snaps a two-day downtrend, as recovery gathers traction toward $5,000 on Wednesday. The US Dollar recovers from the overnight sell-off as rebalancing trades resume ahead of Fed Minutes. The 38.2% Fib support holds on the daily chart for now. What does that mean for Gold?

Pi Network rally defies market pressure ahead of its first anniversary

Pi Network is trading above $0.1900 at press time on Wednesday, extending the weekly gains by nearly 8% so far. The steady recovery is supported by a short-term pause in mainnet migration, which reduces pressure on the PI token supply for Centralized Exchanges. The technical outlook focuses on the $0.1919 resistance as bullish momentum increases.

UK jobs market weakens, bolstering rate cut hopes

In the UK, the latest jobs report made for difficult reading. Nonetheless, this represents yet another reminder for the Bank of England that they need to act swiftly given the collapse in inflation expected over the coming months. 

Top 3 Price Prediction: Bitcoin, Ethereum, and Ripple face downside risk as bears regain control

Bitcoin, Ethereum, and Ripple remain under pressure on Wednesday, with the broader trend still sideways. BTC is edging below $68,000, nearing the lower consolidating boundary, while ETH and XRP also declined slightly, approaching their key supports.