- WTI dropped 0.95% as China’s rate cut and push for increased lending reflect a slowing economy.
- Saudi Arabia’s July oil shipments to China see a significant 31% decline, adding to the bearish sentiment.
- US rig count decreases, hinting at potential supply tightening, which could provide a floor for WTI prices in the near term.
Western Texas Intermediate (WTI), the US crude oil benchmark, posted losses of 0.95% on Monday as China’s economic woes weighed on oil prices. Uncertainty from the US Federal Reserve (Fed) direction on rates favors the greenback, a headwind for US Dollar (USD) denominated assets. WTI is trading at $80.58, down 0.95%.
Despite output cuts from Saudi Arabia and Russia, China’s economic concerns and a resilient US Dollar weigh on crude oil prices
WTI extended its losses despite the People’s Bank of China (PboC) cutting rates by ten basis points in efforts to propel an economy that is continuing to slow down. At the same time, government officials and PboC members urged banks to increase loans.
In the meantime, Saudia Arabia and Russian crude oil output cuts cushioned the WTI drop. However, Saudi Arabia’s July oil shipments to China plunged 31% from June, as revealed by China customs data.
Data supplied y Baker Hughes showed the number of active rigs fell by 4 to 520 in the last week. Supply tightening could keep WTI prices from falling sharply, as noted by ING analysts. They said, “The US has lost 107 oil rigs since early December, and it is not too surprising that this reduced drilling activity means that oil production growth forecasts for later this year and through 2024 are looking relatively modest.”
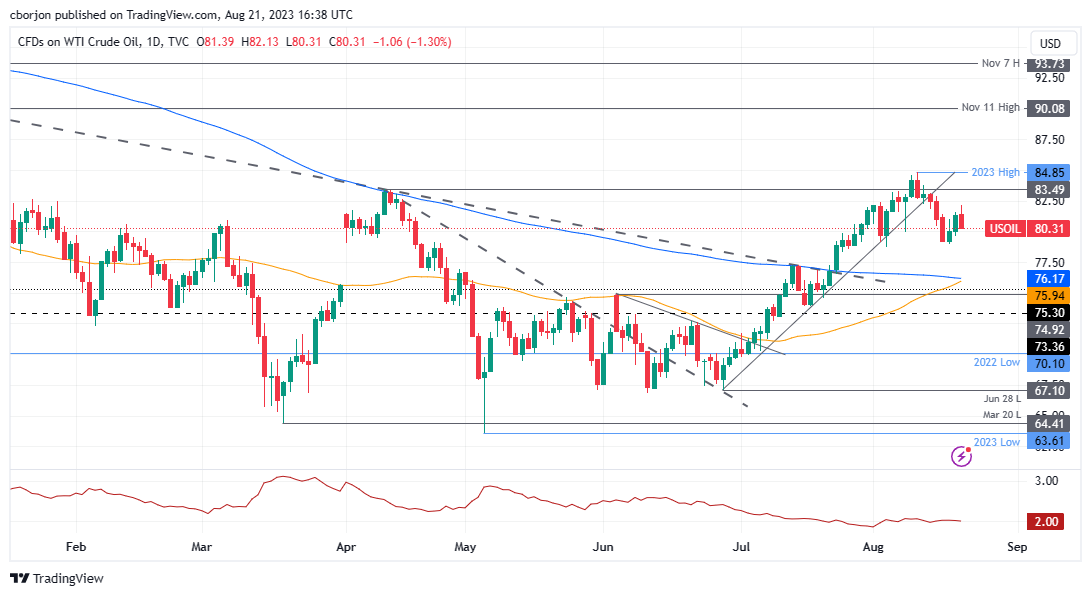
WTI Price Analysis: Technical outlook
From a technical perspective, a golden cross is about to form, which would suggest that oil prices would continue to rally, with the year-to-date (YTD) high seen as the first resistance to challenge at $84.85, followed by the November 11 daily high at $90.08, ahead of the November 7 high at $93.73. Conversely, WTI’s first support would be $80.00 a barrel, followed by the latest swing low of $79.00.
WTI Price Action – Daily chart
Information on these pages contains forward-looking statements that involve risks and uncertainties. Markets and instruments profiled on this page are for informational purposes only and should not in any way come across as a recommendation to buy or sell in these assets. You should do your own thorough research before making any investment decisions. FXStreet does not in any way guarantee that this information is free from mistakes, errors, or material misstatements. It also does not guarantee that this information is of a timely nature. Investing in Open Markets involves a great deal of risk, including the loss of all or a portion of your investment, as well as emotional distress. All risks, losses and costs associated with investing, including total loss of principal, are your responsibility. The views and opinions expressed in this article are those of the authors and do not necessarily reflect the official policy or position of FXStreet nor its advertisers. The author will not be held responsible for information that is found at the end of links posted on this page.
If not otherwise explicitly mentioned in the body of the article, at the time of writing, the author has no position in any stock mentioned in this article and no business relationship with any company mentioned. The author has not received compensation for writing this article, other than from FXStreet.
FXStreet and the author do not provide personalized recommendations. The author makes no representations as to the accuracy, completeness, or suitability of this information. FXStreet and the author will not be liable for any errors, omissions or any losses, injuries or damages arising from this information and its display or use. Errors and omissions excepted.
The author and FXStreet are not registered investment advisors and nothing in this article is intended to be investment advice.
Recommended content
Editors’ Picks
EUR/USD rebounds from multi-week lows, trades above 1.0750

EUR/USD came under heavy bearish pressure and declined to its weakest level in three weeks below 1.0750 on Friday after the stronger-than-expected Nonfarm Payrolls data. Week-end flows, however, helped the pair erase its daily losses.
GBP/USD remains on track to snap three-week winning streak

GBP/USD recovered toward 1.2550 after coming in within a touching distance of 1.2500 in the second half of the day after Nonfarm Payrolls came in at 199,000 for November. Despite the recent rebound, the pair remains on track to snap a three-week winning streak.
Gold retreats below $2,020 as US yields push higher

Gold broke below its daily range and declined toward $2,010 with the immediate reaction to the upbeat US November jobs report. Although XAU/USD managed to recover toward $2,020, rising US Treasury bond yields triggered another leg lower.
Bitcoin price could retrace to $42,000 if US Nonfarm Payroll comes in at 180,000

Bitcoin price just like other assets, is highly impacted by the macro-financial developments. This includes the Nonfarm Payrolls (NFP) report released by the BLS of the United States.
The week ahead – Fed, ECB and Bank of England rate decisions

When the Federal Reserve kept rates unchanged back in November for the second meeting in a row there was still the distinct possibility that the final meeting of 2023 would provide the possibility of one more rate rise to round off the year in line with Fed policymakers dot plot forecasts of 5.6%.