|

USD/ZAR Price Analysis: Bulls lose steam ahead of Fed decision, South African data

  • USD/ZAR declined towards 18.933, near the 20-day SMA.
  • South Africa reports August Inflation figures and July Retail Sales on Wednesday.
  • Federal Reserve (Fed) is expected to pause but leave the door open for further hikes.

 In Tuesday’s session, the USD/ZAR faced some selling pressure and declined to 18.933, down by 0.25%, and seems to be on its way to retest the 20-day Simple Moving Average at 18.880.

All eyes are on Wednesday. South Africa reports the August Consumer Price Index (CPI) with the headline figure expected to increase slightly to 4.8% YoY, while the core inflation rate is anticipated to remain stable at 4.7% YoY. Retail Sales from July are expected to come in at -1.0% YoY, compared to the 0.9% YoY decrease in June. Regarding the South African Reserve Bank meeting on Thursday, the decision will likely be to maintain its interest rates at 8.25% despite some previous expectations of a hike. As for now, for the next twelve years, markets aren’t foreseeing any hikes and discounts that the bank will maintain rates at 8.25%.

On the Fed’s side, Markets expect the bank to keep rates steady at 5.25-5.50%, but Chair Powell will likely show a hawkish tone and signal future rate hikes which could benefit the USD. Strong US economic performance, especially in services, and a mixed labour market suggest the Fed may leave room for one more hike to curb inflation risks.

USD/ZAR Levels to watch 

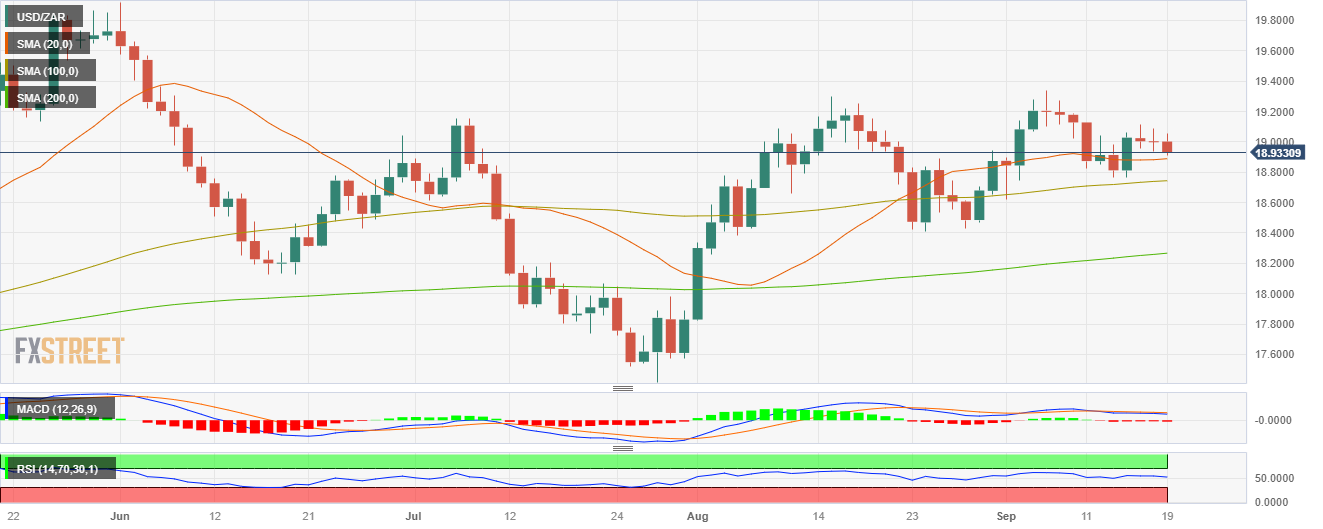
 The daily chart shows signs of bullish exhaustion for USD/ZAR. The Relative Strength Index (RSI) indicates a neutral stance above its midline, displaying a flat slope in the positive territory, while the Moving Average Convergence (MACD) presents neutral red bars. On the bigger picture, the pair is above the 20,100,200-day Simple Moving Average (SMA), suggesting that the bears are struggling to challenge the overall bullish trend.

 Support levels: 18.880 (20-day SMA), 18.728 (100-day SMA). 18.500.

 Resistance levels: 19.000, 19.050, 19.150.

 USD/ZAR Daily Chart

USD/ZAR

Overview
Today last price18.933
Today Daily Change-0.0688
Today Daily Change %-0.36
Today daily open19.0018
 
Trends
Daily SMA2018.8827
Daily SMA5018.5785
Daily SMA10018.7397
Daily SMA20018.2589
 
Levels
Previous Daily High19.0902
Previous Daily Low18.9346
Previous Weekly High19.1283
Previous Weekly Low18.7634
Previous Monthly High19.2985
Previous Monthly Low17.8264
Daily Fibonacci 38.2%18.9941
Daily Fibonacci 61.8%19.0308
Daily Pivot Point S118.9275
Daily Pivot Point S218.8533
Daily Pivot Point S318.7719
Daily Pivot Point R119.0831
Daily Pivot Point R219.1645
Daily Pivot Point R319.2387

Author

Patricio Martín

Patricio is an economist from Argentina passionate about global finance and understanding the daily movements of the markets.

More from Patricio Martín
Share:

Markets move fast. We move first.

Orange Juice Newsletter brings you expert driven insights - not headlines. Every day on your inbox.

By subscribing you agree to our Terms and conditions.

Editor's Picks

EUR/USD moves sideways below 1.1800 on Christmas Eve

EUR/USD struggles to find direction and trades in a narrow channel below 1.1800 after posting gains for two consecutive days. Bond and stock markets in the US will open at the usual time and close early on Christmas Eve, allowing the trading action to remain subdued. 

GBP/USD keeps range around 1.3500 amid quiet markets

GBP/USD keeps its range trade intact at around 1.3500 on Wednesday. The Pound Sterling holds the upper hand over the US Dollar amid pre-Christmas light trading as traders move to the sidelines heading into the holiday season. 

Gold retreats from record highs, trades below $4,500

Gold retreats after setting a new record-high above $4,520 earlier in the day and trades in a tight range below $4,500 as trading volumes thin out ahead of the Christmas break. The US Dollar selling bias remains unabated on the back of dovish Fed expectations, which continues to act as a tailwind for the bullion amid persistent geopolitical risks.

Bitcoin slips below $87,000 as ETF outflows intensify, whale participation declines

Bitcoin price continues to trade around $86,770 on Wednesday, after failing to break above the $90,000 resistance. US-listed spot ETFs record an outflow of $188.64 million on Tuesday, marking the fourth consecutive day of withdrawals.

Economic outlook 2026-2027 in advanced countries: Solidity test

After a year marked by global economic resilience and ending on a note of optimism, 2026 looks promising and could be a year of solid economic performance. In our baseline scenario, we expect most of the supportive factors at work in 2025 to continue to play a role in 2026.

Avalanche struggles near $12 as Grayscale files updated form for ETF

Avalanche trades close to $12 by press time on Wednesday, extending the nearly 2% drop from the previous day. Grayscale filed an updated form to convert its Avalanche-focused Trust into an ETF with the US Securities and Exchange Commission.