|

USD/MXN trades below the 20-DMA ahead of Fed’s monetary policy decision

  • USD/MXN down 0.37%, trading at 17.0685, as the Mexican Peso recovers some of its losses.
  • Investors turn cautious ahead of the Federal Reserve meeting, where updated economic projections are expected.
  • Preliminary data from INEGI suggests the Mexican economy likely grew 3.4% YoY in August.

The Mexican Peso (MXN) erases some of its Monday’s losses versus the Greenback (USD) and reclaims the 20-day Moving Average (DMA) despite a firm US Dollar (USD), with traders bracing for tomorrow’s US Federal Reserve’s decision. At the time of writing, the USD/MXN is trading at 17.0685, down 0.37%.

USD/MXN trades lower despite a strong US Dollar, as investors await updated economic projections from the Federal Reserve

Investor sentiment has turned negative ahead of the Fed meeting. During the last economic projections, the Fed anticipated 1% economic growth, a 4.1% unemployment rate, 3.2% PCE inflation, 3.9% core PCE inflation, and the Federal Funds Rate (FFR) peaking at 5.60%. These projections will be updated and play a crucial role in shaping the Fed’s future policy decisions.

In the meantime, housing data was revealed and came worse than expected. Housing starts slumped 11.3% last month, the lowest level since June 2020. Data for July was revised lower to show starts accelerating to a rate of 1.447 million units instead of the previously reported 1.452 million units. Meanwhile, Building Permits jumped 6.9% above the prior month’s 0.1% expansion, the most significant rise in six months.

Meanwhile, US Treasury bond yields are trading in positive territory, with the 10-year note coupon yielding 4.337% amidst a US 20-year bond auction, while the Greenback, as shown by the US Dollar Index (DXY), is firm at around 105.12.

Across the border, the Mexican economic docket revealed a poll by the Instituto Nacional de Estadisitca Geografia e Informatica (INEGI), which shows the economy likely grew 3.4% in August compared with the same month a year earlier, in a preliminary estimate from the statistics agency.

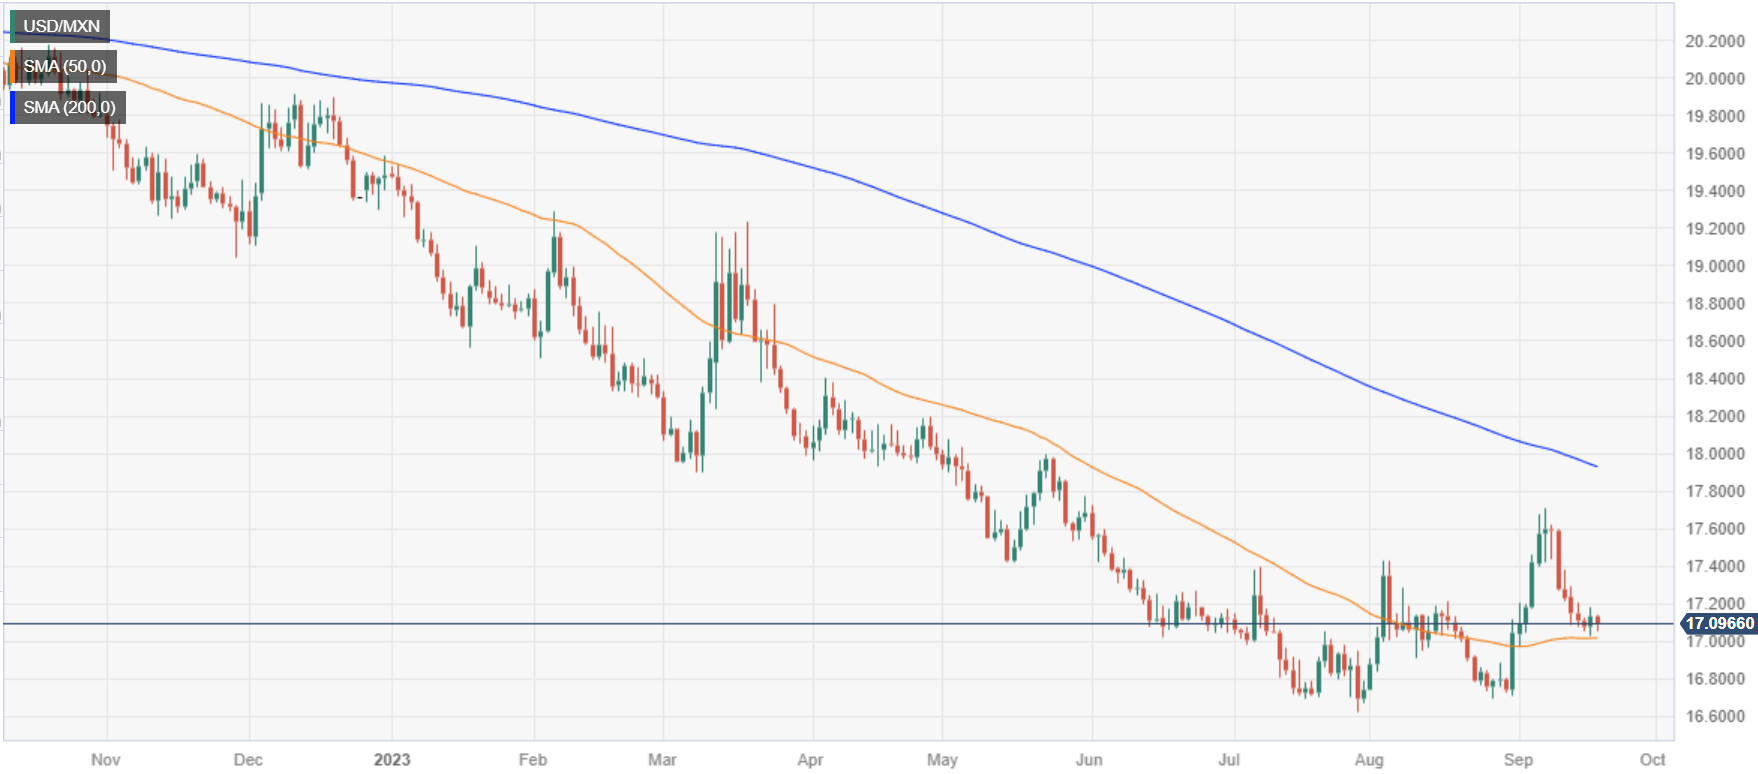
USD/MXN Price Analysis: Technical outlook

At the beginning of the week, the USD/MXN could not crack the 100-DMA at 17.2091, opening the door for a pullback, which witnessed the pair breaching the 20-DMA at 17.1075. With that said, and with price action below most Moving Averages, the exotic pair could again test the psychological 17.00 figure. However, it must challenge the 50-DMA at 17..0101 before sliding towards the figure and beyond. For a bullish resumption, the USD/MXN must reclaim the 100-DMA, followed by the 17.5000 figure.

USD/MXN

Overview
Today last price17.1002
Today Daily Change-0.0353
Today Daily Change %-0.21
Today daily open17.1355
 
Trends
Daily SMA2017.1046
Daily SMA5017.0167
Daily SMA10017.2252
Daily SMA20017.9425
 
Levels
Previous Daily High17.1825
Previous Daily Low17.0304
Previous Weekly High17.5959
Previous Weekly Low17.0504
Previous Monthly High17.4274
Previous Monthly Low16.6945
Daily Fibonacci 38.2%17.1244
Daily Fibonacci 61.8%17.0885
Daily Pivot Point S117.0497
Daily Pivot Point S216.964
Daily Pivot Point S316.8976
Daily Pivot Point R117.2019
Daily Pivot Point R217.2683
Daily Pivot Point R317.354

Author

Christian Borjon Valencia

Christian Borjon began his career as a retail trader in 2010, mainly focused on technical analysis and strategies around it. He started as a swing trader, as he used to work in another industry unrelated to the financial markets.

More from Christian Borjon Valencia
Share:

Markets move fast. We move first.

Orange Juice Newsletter brings you expert driven insights - not headlines. Every day on your inbox.

By subscribing you agree to our Terms and conditions.

Editor's Picks

EUR/USD eyes 1.1800 barrier near two-month highs

EUR/USD extends its gains for the second consecutive day on Tuesday and approaches 1.1800. On the daily chart, technical analysis indicates a persistent bullish bias, as the pair moves upward within the ascending channel pattern. Additionally, the 14-day Relative Strength Index at 68.89 reaffirms the bullish bias.

GBP/USD climbs to 1.3500 area, renews ten-week high

GBP/USD extends its weekly rally and trades at its highest level since early October near 1.3500. The US Dollar remains under persistent bearish pressure heading into the holidays, while Pound traders largely brush off the latest interest rate cut from the Bank of England.

Gold approaches $4,500 as record-setting rally continues

Gold builds on Monday's impressive gains and advances toward $4,500, setting fresh record-highs along the way. Heightened geopolitical tensions, combined with the broad-based US Dollar (USD) weakness ahead of the Q3 GDP data, help XAU/USD preserve its bullish momentum.

Uniswap holds above $6 as traders eye UNIfication vote outcome

Uniswap price holds above $6 at the time of writing on Tuesday after closing above a key resistance zone in the previous week. Traders are focusing on the highly anticipated UNIfication proposal, which is set to conclude on Thursday, and could become a key near-term catalyst. On the technical side, momentum indicators are flashing bullish signals, hinting at an upside rally.

Ten questions that matter going into 2026

2026 may be less about a neat “base case” and more about a regime shift—the market can reprice what matters most (growth, inflation, fiscal, geopolitics, concentration). The biggest trap is false comfort: the same trades can look defensive… right up until they become crowded.

XRP steadies above $1.90 support as fund inflows and retail demand rise

Ripple (XRP) is stable above support at $1.90 at the time of writing on Monday, after several attempts to break above the $2.00 hurdle failed to materialize last week. Meanwhile, institutional interest in the cross-border remittance token has remained steady.