USD/MXN stumbles as sentiment improves despite higher US bond yields
- USD/MXN reverses its course and aims toward $18.50 on a risk-on mood.
- Inflation in the United States was aligned with forecasts, though it remains high.
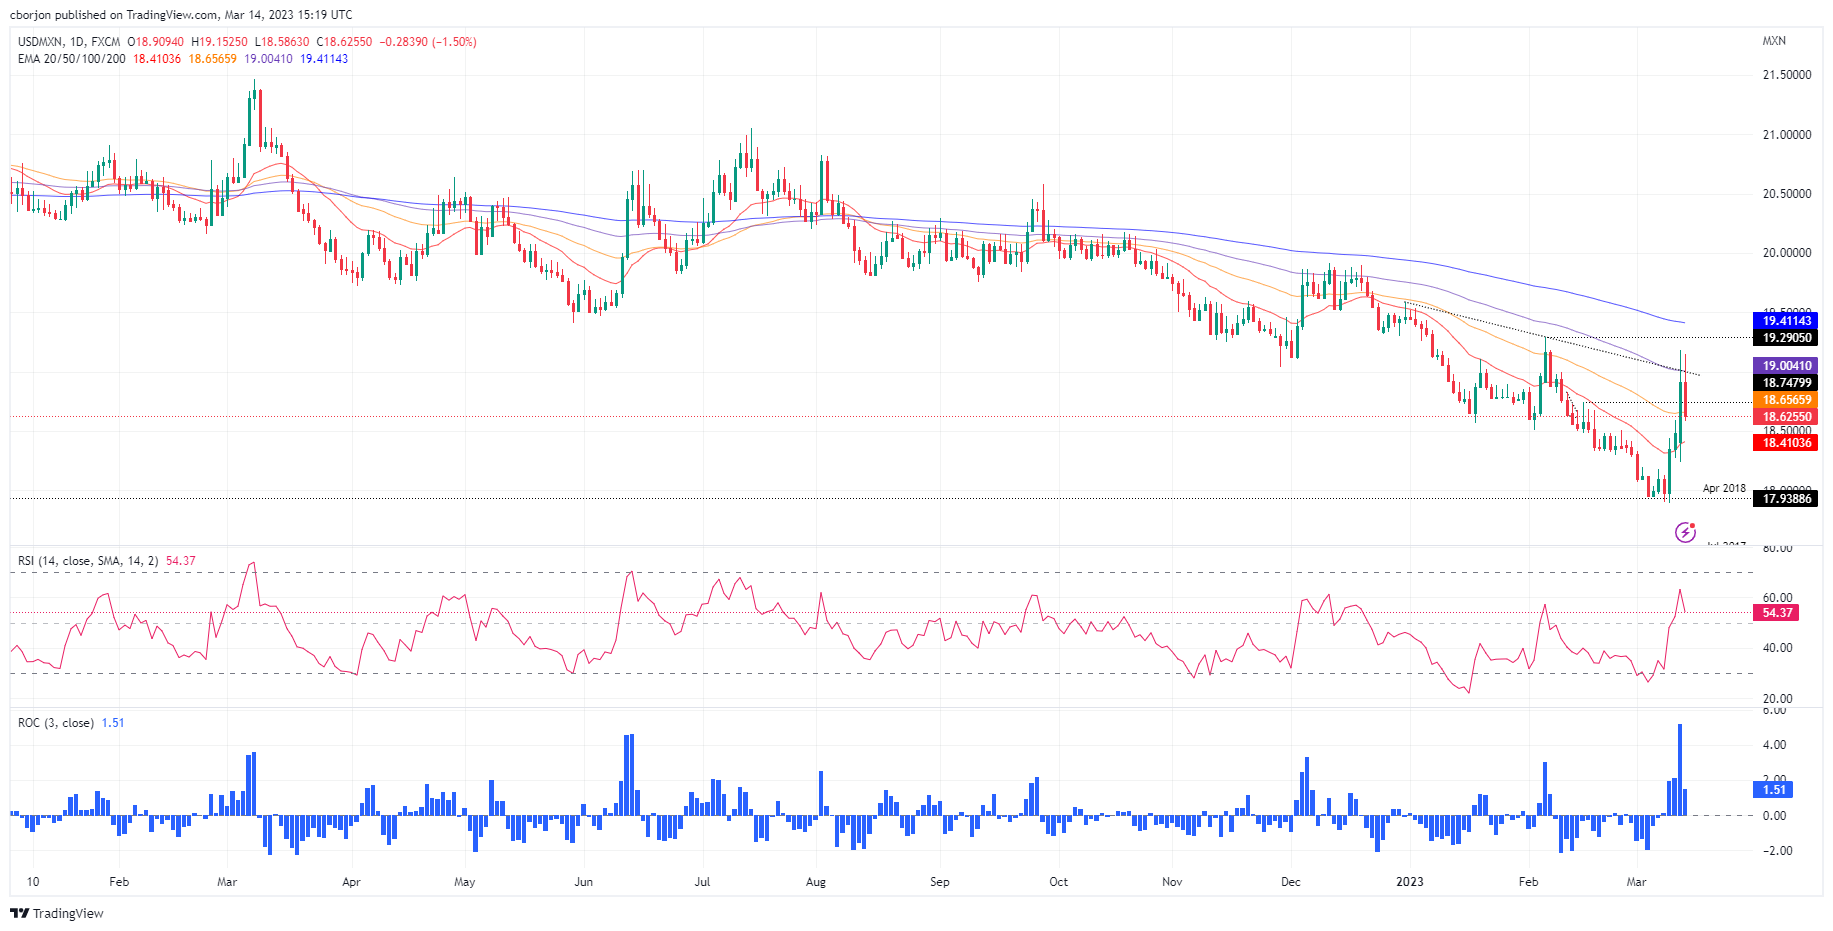
- USD/MXN Price Analysis: Break beneath the 50-day EMA will pave the way to 18.0000.

The Mexican Peso (MXN) states a recovery after the bank crisis in the United States (US) appears to calm, as a risk-on impulse underpinned global equities. The CBOE Volatility Index (VIX) has fallen from weekly highs of 30.81 to the 23.00 region, while inflation figures in the US ticked down. At the time of writing, the USD/MXN is trading at 18.6200.
USD/MXN falls on sentiment improvement
Global equities resumed to the upside due to easing concerns about the failure of three banks in the US. The US Bureau of Labor Statistics (BLS) revealed that US inflation in February was in line with estimates on annual readings. The Consumer Price Index (CPI) rose 6%, while the core CPI was 5.5%. On a monthly basis, CPI was 0.4%, aligned with the consensus, while core CPI edged up to 0.5%, above forecasts.
Last week, the US Federal Reserve (Fed) Chair Jerome Powell commented that the Federal Funds Rate (FFR) would peak higher than expected. Also, he stressed that solid incoming data would accelerate the pace of interest rate increases. But the recent turmoil in the US banking system keeps traders repricing a less hawkish Fed amidst fears that more institutions could fall under the water.
The CME FedWatch Tool shows Fed odds for a 25 bps rate hike lying at 86.4%, compared to last week’s 69.8% chance for a 50 bps rate hike.
That has triggered a reaction in the US fixed-income market. US Treasury bond yields are recovering, as shown by 2s and 10s, each gaining 35 and six basis points, respectively. The US Dollar Index (DXY), a measure of the buck’s value against a basket of six currencies, edges high 0.13%, at 103.754.
Nevertheless, the USD/MXN continued dropping amidst investors seeking return, as the interest rate differential between the US and Mexico favors the Mexican currency.
USD/MXN Technical analysis
From a technical perspective, the USD/MXN shifted neutral, though testing the 50-day Exponential Moving Average (EMA) at 18.6568. Even though the pair rallied to a five-week high at 19.1789, buyers failed to hold their gains above the 19.0000 figure. In addition, after skyrocketing, the Relative Strength Index (RSI) edged toward the neutral reading, suggesting that buying pressure is waning.
On the upside, the USD/MXN first resistance would be the 50-day EMA, followed by the 100-day EMA At 19.0043. A breach of the latter will expose the February 6 high at 19.2905 and the 200-day EMA At 19.4112. On the flip side, the USD/MXN first support would be 18.5000, followed by the 20-day EMA at 18.4100, followed by March’s 13 low of 18.2369.
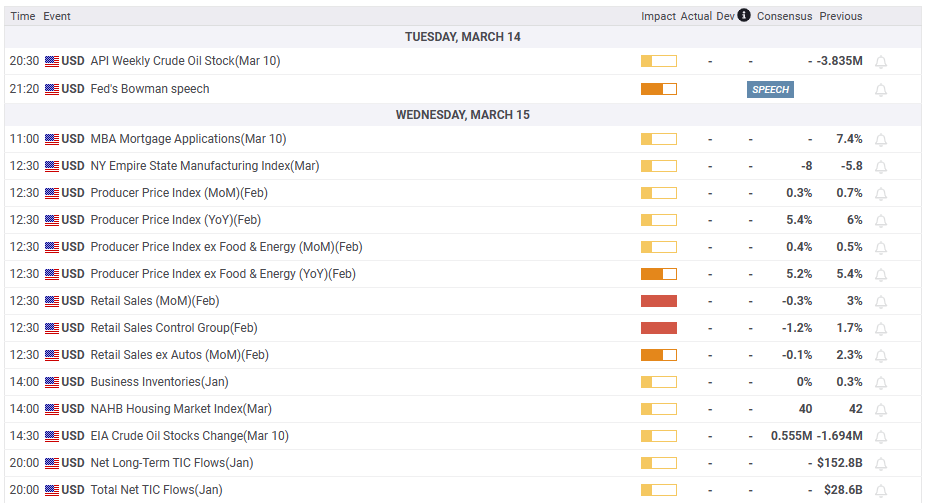
What to watch?
Author

Christian Borjon Valencia
FXStreet
Markets analyst, news editor, and trading instructor with over 14 years of experience across FX, commodities, US equity indices, and global macro markets.


