USD/MXN slumps below 17.2000 as Mexican inflation cools down, US NFP disappoints
- Mexican Peso recovers as weak US data sparks a sell-off, bringing USD/MXN down from a four-week high.
- US job growth disappoints, triggering Dollar weakness; inflation fears persist as Average Hourly Earnings rise.
- Mexican inflation declines for the fifth month, defying estimates; CME FedWatch Tool shows heightened odds for a Fed rate hike.

The Mexican Peso (MXN) recovered some ground on Friday as soft data on the United States (US) triggered a US Dollar (USD) sell-off. Hence the USD/MXN dropped from four-week highs, trading at 17.1388, down 0.55%.
USD/MXN reacts to underwhelming Nonfarm Payrolls figures and inflation concerns
The US Department of Labor revealed that June’s Nonfarm Payrolls figures for June showed that the economy added 209K jobs, beneath forecasts of 225K, triggering US Dollar weakness across the board. The Unemployment Rate portrayed a tight labor market, with June figures coming at 3.6% vs. 3.7%, while Average Hourly Earning (AHE) expanded 4.4% YoY, above the prior’s month 4.2%, adding to inflationary pressures, keeping the US Federal Reserve (Fed) under pressure.
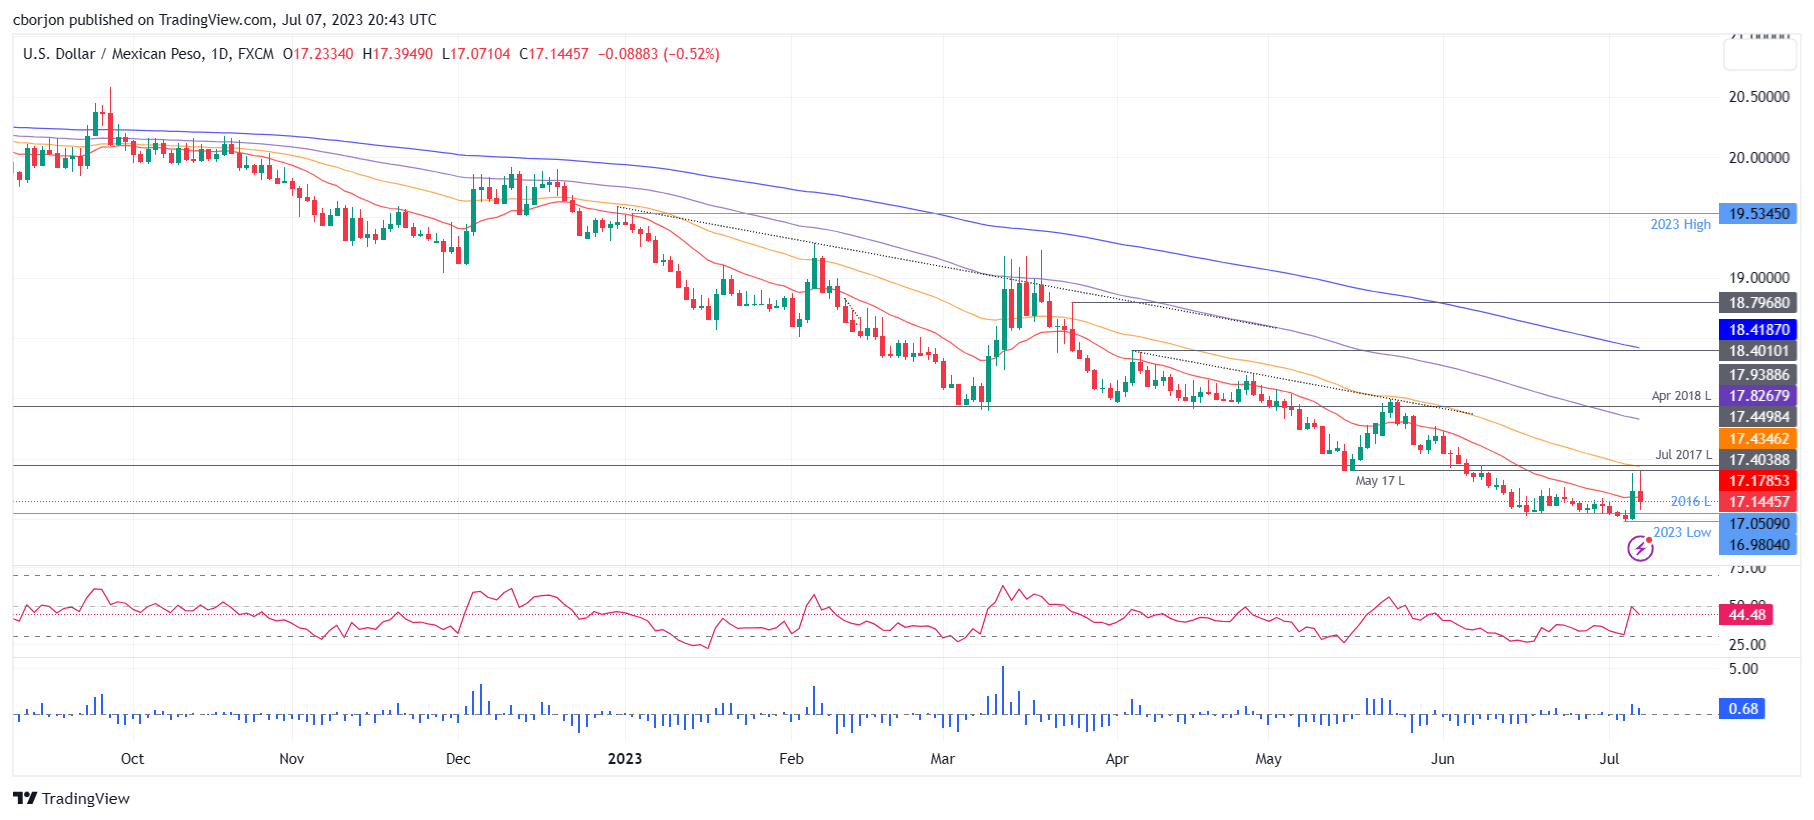
Following the data, the USD/MXN continued its downtrend, falling from 17.30 to 17.11. Meanwhile, the US 10-year Treasury note yields 4.058%, falls one and a half basis points, while the US Dollar Index (DXY), a gauge of the buck’s value against a basket of six currencies, dives to 102.279, losses 0.81% after staying above the 103.000 during the past four days.
Across the border, the Mexican economic docker revealed June’s inflation fell for the fifth straight month to 5.06%, as shown by INEGI. Consumer prices dropped 0.10% in June from May, exceeding estimates of -0.09%. Annual core CPI which strips volatile items, was 6.89% in June, above forecasts of 6.87%.
Regarding expectations for the US Federal Reserve (Fed) July monetary policy, the CME FedWatch Tool shows odds standing at 92.4%, higher than last week’s 86.8%; nonetheless, investors are not estimating additional hikes, even though the Fed’s dot-plot shows the Federal Funds Rate (FFR) peaking at 5.6%.
USD/MXN Price Analysis: Technical outlook
Given the fundamental backdrop, the USD/MXN would likely continue to edge down as the interest rate differential between Mexico (11.25%), and the US (5.125%) favors the Mexican Peso (MXN). The USD/MXN could be re-testing the 17.0000 figure, but some support levels must be surpassed on its way down. The USD/MXN’s first support level would be the 17.1000 mark, followed by the 17.0000 figure. Breach of the latter will expose the year-to-date (YTD) low at 16.9761.
Author

Christian Borjon Valencia
FXStreet
Markets analyst, news editor, and trading instructor with over 14 years of experience across FX, commodities, US equity indices, and global macro markets.