USD/MXN Price Forecast: Holds position above 18.50, tests barrier at nine-day EMA
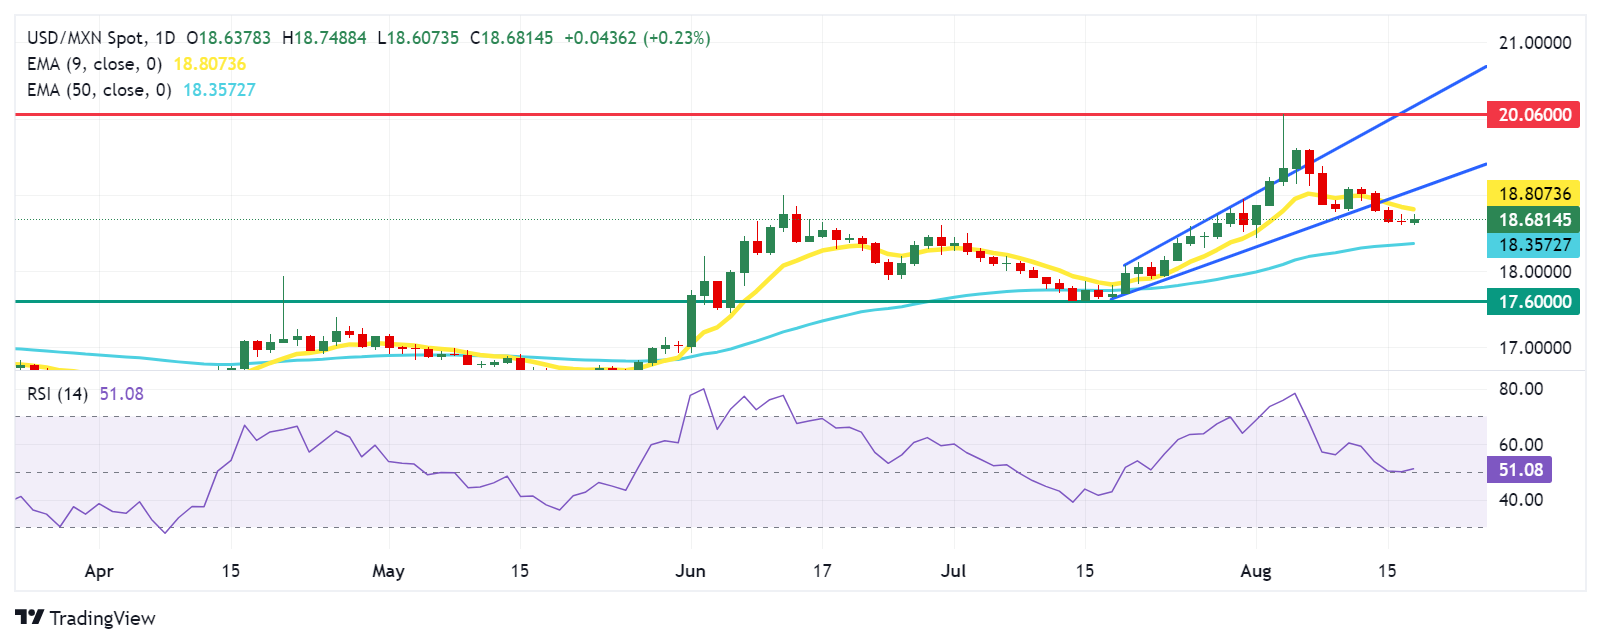
- USD/MXN price tests the nine-day EMA at the 18.81 level, followed by the lower boundary of the channel.
- The 9-day EMA is higher than the 50-day EMA, indicating a bullish signal for the short-term price trend.
- A return to the ascending channel would reinforce the bullish bias, leading the pair to test the upper boundary.

The USD/MXN pair halts its four-day losing streak, trading around 18.70 during the European session on Monday. The daily chart analysis shows that the pair is consolidating below an ascending channel pattern, indicating a potential weakening of the bullish bias.
Additionally, the 14-day Relative Strength Index (RSI) is positioned slightly above the 50 level, suggesting a bullish momentum. Further movement may offer a clear directional trend.
Moreover, the 9-day Exponential Moving Average (EMA) is higher than the 50-day EMA, indicating a bullish signal for the USD/MXN pair. This suggests that the short-term price trend is stronger than the long-term trend, which could imply upward momentum in the asset's price.
On the upside, the nine-day Exponential Moving Average (EMA) at the 18.81 level serves as an immediate barrier, followed by the lower boundary of the ascending channel around the 19.00 level.
A return to the ascending channel would reinforce the bullish bias, potentially leading the USD/MXN pair to explore the region around the upper boundary of the ascending channel at 20.06, the highest level since October 2022, which was reached on August 5.
In terms of support, the 50-day EMA at 18.35 appears as a key support level. A break below this level could initiate the emergence of the bearish bias and push the USD/MXN pair to navigate the area around throwback support at the 17.60 level.
USD/MXN: Daily Chart
Mexican Peso FAQs
The Mexican Peso (MXN) is the most traded currency among its Latin American peers. Its value is broadly determined by the performance of the Mexican economy, the country’s central bank’s policy, the amount of foreign investment in the country and even the levels of remittances sent by Mexicans who live abroad, particularly in the United States. Geopolitical trends can also move MXN: for example, the process of nearshoring – or the decision by some firms to relocate manufacturing capacity and supply chains closer to their home countries – is also seen as a catalyst for the Mexican currency as the country is considered a key manufacturing hub in the American continent. Another catalyst for MXN is Oil prices as Mexico is a key exporter of the commodity.
The main objective of Mexico’s central bank, also known as Banxico, is to maintain inflation at low and stable levels (at or close to its target of 3%, the midpoint in a tolerance band of between 2% and 4%). To this end, the bank sets an appropriate level of interest rates. When inflation is too high, Banxico will attempt to tame it by raising interest rates, making it more expensive for households and businesses to borrow money, thus cooling demand and the overall economy. Higher interest rates are generally positive for the Mexican Peso (MXN) as they lead to higher yields, making the country a more attractive place for investors. On the contrary, lower interest rates tend to weaken MXN.
Macroeconomic data releases are key to assess the state of the economy and can have an impact on the Mexican Peso (MXN) valuation. A strong Mexican economy, based on high economic growth, low unemployment and high confidence is good for MXN. Not only does it attract more foreign investment but it may encourage the Bank of Mexico (Banxico) to increase interest rates, particularly if this strength comes together with elevated inflation. However, if economic data is weak, MXN is likely to depreciate.
As an emerging-market currency, the Mexican Peso (MXN) tends to strive during risk-on periods, or when investors perceive that broader market risks are low and thus are eager to engage with investments that carry a higher risk. Conversely, MXN tends to weaken at times of market turbulence or economic uncertainty as investors tend to sell higher-risk assets and flee to the more-stable safe havens.
Author

Akhtar Faruqui
FXStreet
Akhtar Faruqui is a Forex Analyst based in New Delhi, India. With a keen eye for market trends and a passion for dissecting complex financial dynamics, he is dedicated to delivering accurate and insightful Forex news and analysis.