|

USD/MXN Price Analysis: Mexican Peso seesaws between 18.20 and 17.97 key levels

  • USD/MXN struggles to extend two-day uptrend as steady RSI joins five-week-old horizontal resistance to prod buyers.
  • Convergence of previous resistance line from March 20, one-month-old ascending support line challenges Mexican Peso bulls.
  • Bullish MACD signals, sustained trend line breakout keeps pair buyers hopeful.

USD/MXN treads water around 18.13 ahead of Wednesday’s European session as traders seek more clues to extend the previous two days’ recovery moves.

That said, the Mexican Peso (MXN) pair crossed a fortnight-long descending trend line the previous day and convinced buyers amid bullish MACD signals.

However, an area comprising the 50-SMA and multiple tops marked since early March challenges the USD/MXN bulls afterward around 18.20. Also raising doubts about the quote’s further upside is the steady RSI (14).

Hence, the pair’s further upside momentum needs to cross the 18.20 hurdle to convince bulls, which in turn highlights a nine-week-old resistance zone surrounding 18.50-55.

On the flip side, the previous resistance line from March 20 and an upward-sloping support line from early March together highlight 17.97 as a tough nut to crack for the USD/MXN bears.

In a case where the Mexican Peso buyers dominate past 17.97, the odds of witnessing a quick slump toward the April 2018 bottom of near 17.93 can’t be ruled out. Following that, the August 2017 low of around 17.57 will be in focus.

Overall, USD/MXN portrays bearish consolidation as the market awaits the key US activity and job numbers.

USD/MXN: Four-hour chart

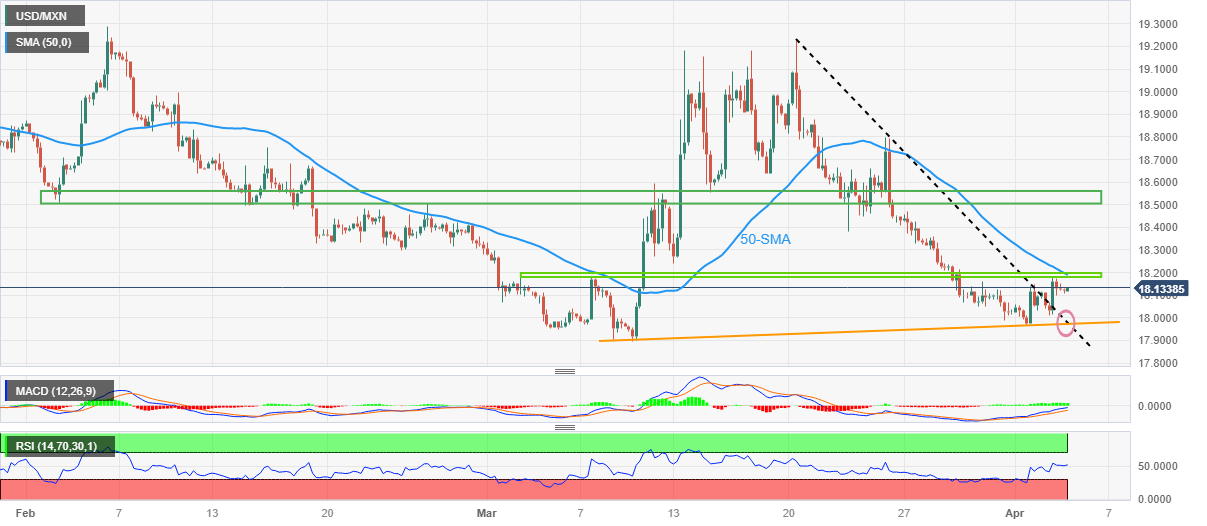
Trend: Further upside expected

Author

Anil Panchal

Anil Panchal

FXStreet

Anil Panchal has nearly 15 years of experience in tracking financial markets. With a keen interest in macroeconomics, Anil aptly tracks global news/updates and stays well-informed about the global financial moves and their implications.

More from Anil Panchal
Share:

Editor's Picks

EUR/USD seems fragile below 1.1700 as Middle East war boosts energy prices

The EUR/USD pair trades flat at around 1.1680 during the Asian trading session on Tuesday, but broadly seems vulnerable, being close to its five-week low. The major currency pair is under pressure as surging oil prices due to the United States-Israel war with Iran have increased the risks of higher inflation for the Old Continent.

GBP/USD hovers around 1.3400 with bearish pressure intact

GBP/USD edges higher after three days of losses, trading around 1.3400 during the Asian hours on Tuesday. The technical analysis of the daily chart indicates an ongoing bearish bias, as the pair trades within a descending channel pattern.

Gold stays bullish as Iran war continues to spur safe-haven flows

Gold is finding renewed bids in Asian trades on Tuesday, making another attempt to regain the $5,400 level amid persistent demand for safe-haven assets as the Iran war extends. A softer risk tone remains in play as US President Donald Trump continues to threaten deeper escalation to the ongoing war with Iran, warning that a “big wave” is yet to come.

Top Crypto Gainers: Near Protocol, Virtuals Protocol, and Morpho lead market recovery

Near Protocol, Virtuals Protocol, and Morpho are leading the market recovery with double-digit gains over the last 24 hours. Technically, NEAR extends the breakout of the falling channel pattern, VIRTUAL holds above the 50-day EMA, while MORPHO tests a crucial resistance. 

The market is not panicking it is repricing the probability distribution of Oil and time

At the end of the day, markets do not trade morality or geopolitics. They trade transmission channels. And the only channel that truly matters in this maelstrom runs through the price of energy and the time value of money.

Grass 20% bullish breakout defies broader market weakness

Grass (GRASS) is edging up above $0.30 at the time of writing on Monday. The token’s notable 20% intraday surge stands out amid heightened volatility in the broader crypto market.