• USD/MXN plunges to multi-year lows around $18.01, despite Banxico’s cutting growth in Mexico.
  • An upbeat US ISM Non-Manufacturing PMI could trigger a recovery in the USD/MXN; otherwise, a fall below $18.00 is on the cards.
  • USD/MXN Price Analysis: Bad US economy data could trigger a break below $18.00

The Mexican Peso (MXN) appreciates against the US Dollar (USD), as the USD/MXN falls to multi-year lows last seen in April 2018 at 18.0148, despite Banxico (Mexican Central Bank) cutting the growth forecast for Mexico in 2023 and 2024. At the time of writing, the USD/MXN exchanges hand at 18.0479, with losses of 0.39%.

USD/MXN falls to 5-year lows at $18.01, US ISM Services PMI eyed

Wall Street is set for a higher open. Global S&P Services and Composite PMIs improved globally, a sign that the worldwide economy is in better shape than foreseen, as traders moved to riskier assets as bond yields eased. A measure of the greenback, the US Dollar Index, drops 0.25% to 104.657.

On Wednesday, Banxico revealed that Mexico’s economy in 2023 and 2024 would grow at a slower pace than initially expected, blamed on the deterioration of US expectations, namely in the industrial sector, according to an inflation report. Banxico forecasts economic growth of 1.6% for Mexico in 2023, lower than the 1.8% estimated, while for 2024, the projection is reduced to 1.8% from 2.1%.

At around 15:00 GMT, the Institute for Supply Management (ISM) would reveal the Non-Manufacturing PMI for February, expected to come at 54.5, below January’s 55.2. Due to high inflationary readings in the United States (US), the prices subcomponent would be closely monitored by investors, with the ISM Prices Paid Index expected to rise to drop from 67.8 in January to 64.5 in February.

An upbeat US ISM Non-Manufacturing report could trigger flows to the US Dollar, which means the USD/MXN could rise from YTD lows. In addition, speculations that Banxico is near pausing its tightening cycle would reduce the interest rate differentials between the US and Mexico. Also, sentiment deterioration would play an important piece of the puzzle in the future of the USD/MXN pair.

Also read: When is the US ISM Services PMI, and how could it affect EUR/USD?

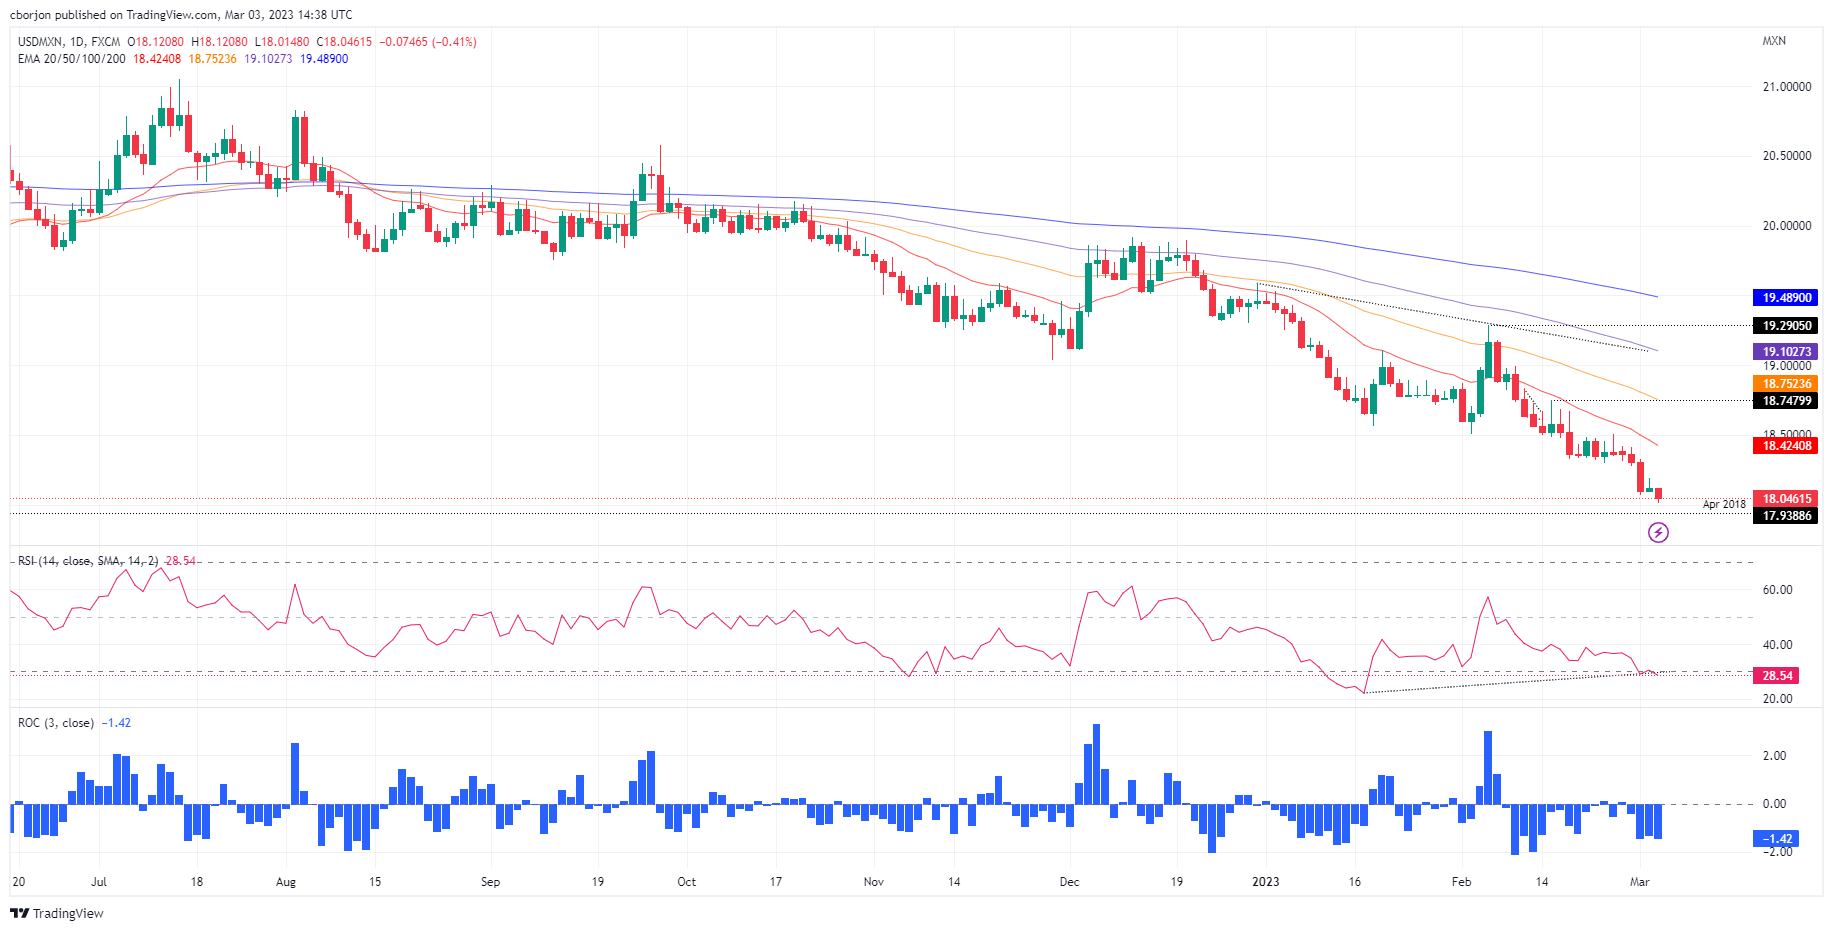
USD/MXN Technical analysis

The USD/MXN daily chart portrays the pair as downward biased. After the USD/MXN pair consolidated around $18.30, Wednesday’s fall opened the door to test the 18.0000 psychological barriers. A breach of the latter will expose April’s 2018 swing low at 17.9388, followed by July’s 2017 lows of 17.4498. On the other hand, if the USD/MXN recovers above 18.1930, March’s 2 high, that would open the door to test the MTD high at 18.3296.

USD/MXN Technical levels

USD/MXN

Overview
Today last price 18.0506
Today Daily Change -0.0782
Today Daily Change % -0.43
Today daily open 18.1288
 
Trends
Daily SMA20 18.5436
Daily SMA50 18.8403
Daily SMA100 19.236
Daily SMA200 19.6896
 
Levels
Previous Daily High 18.1938
Previous Daily Low 18.094
Previous Weekly High 18.5056
Previous Weekly Low 18.2984
Previous Monthly High 19.2901
Previous Monthly Low 18.2954
Daily Fibonacci 38.2% 18.1557
Daily Fibonacci 61.8% 18.1321
Daily Pivot Point S1 18.084
Daily Pivot Point S2 18.0391
Daily Pivot Point S3 17.9842
Daily Pivot Point R1 18.1837
Daily Pivot Point R2 18.2386
Daily Pivot Point R3 18.2835


Share: Feed news

Information on these pages contains forward-looking statements that involve risks and uncertainties. Markets and instruments profiled on this page are for informational purposes only and should not in any way come across as a recommendation to buy or sell in these assets. You should do your own thorough research before making any investment decisions. FXStreet does not in any way guarantee that this information is free from mistakes, errors, or material misstatements. It also does not guarantee that this information is of a timely nature. Investing in Open Markets involves a great deal of risk, including the loss of all or a portion of your investment, as well as emotional distress. All risks, losses and costs associated with investing, including total loss of principal, are your responsibility. The views and opinions expressed in this article are those of the authors and do not necessarily reflect the official policy or position of FXStreet nor its advertisers. The author will not be held responsible for information that is found at the end of links posted on this page.

If not otherwise explicitly mentioned in the body of the article, at the time of writing, the author has no position in any stock mentioned in this article and no business relationship with any company mentioned. The author has not received compensation for writing this article, other than from FXStreet.

FXStreet and the author do not provide personalized recommendations. The author makes no representations as to the accuracy, completeness, or suitability of this information. FXStreet and the author will not be liable for any errors, omissions or any losses, injuries or damages arising from this information and its display or use. Errors and omissions excepted.

The author and FXStreet are not registered investment advisors and nothing in this article is intended to be investment advice.

Recommended content


Recommended content

Editors’ Picks

AUD/USD hovers around 0.6500 amid light trading, ahead of US GDP

AUD/USD hovers around 0.6500 amid light trading, ahead of US GDP

AUD/USD is trading close to 0.6500 in Asian trading on Thursday, lacking a clear directional impetus amid an Anzac Day holiday in Australia. Meanwhile, traders stay cautious due ti risk-aversion and ahead of the key US Q1 GDP release. 

AUD/USD News

USD/JPY finds its highest bids since 1990, near 155.50

USD/JPY finds its highest bids since 1990, near 155.50

USD/JPY keeps breaking into its highest chart territory since June of 1990 early Thursday, testing 155.50 for the first time in 34 years as the Japanese Yen remains vulnerable, despite looming Japanese intervention risks. Focus shifts to Thursday's US GDP report and the BoJ decision on Friday. 

USD/JPY News

Gold price treads water near $2,320, awaits US GDP data

Gold price treads water near $2,320, awaits US GDP data

Gold price recovers losses but keeps its range near $2,320 early Thursday. Renewed weakness in the US Dollar and the US Treasury yields allow Gold buyers to breathe a sigh of relief. Gold price stays vulnerable amid Middle East de-escalation, awaiting US Q1 GDP data. 

Gold News

Injective price weakness persists despite over 5.9 million INJ tokens burned

Injective price weakness persists despite over 5.9 million INJ tokens burned

Injective price is trading with a bearish bias, stuck in the lower section of the market range. The bearish outlook abounds despite the network's deflationary efforts to pump the price. Coupled with broader market gloom, INJ token’s doomed days may not be over yet.

Read more

Meta Platforms Earnings: META sinks 10% on lower Q2 revenue guidance Premium

Meta Platforms Earnings: META sinks 10% on lower Q2 revenue guidance

This must be "opposites" week. While Doppelganger Tesla rode horrible misses on Tuesday to a double-digit rally, Meta Platforms produced impressive beats above Wall Street consensus after the close on Wednesday, only to watch the share price collapse by nearly 10%.

Read more

Forex MAJORS

Cryptocurrencies

Signatures