USD/JPY technical analysis: Break of 109.00 highlights 108.70 for sellers
- Break of 109.00 highlights 15-week old support-line.
- RSI may raise questions for bears.

Having slipped beneath 109.00, the USD/JPY pair is up for further weakness as it trades near 108.95 during early Friday.
A downward sloping trend-line since mid-February at 108.70 grabs the immediate attention of sellers ahead of diverting them to 50% Fibonacci retracement of January to April rise near 108.55.
However, oversold levels of 14-day relative strength index (RSI) could stop bears from portraying further declines, if not then 108.00 and 61.8% Fibonacci retracement near 107.70 can appear on their targets.
On the upside, March month bottom near 109.75 and a descending trend-line since April around 110.05 can limit near-term advances of the pair.
Given the price rally beyond 110.05, 23.6% Fibonacci retracement and 100-day simple moving average (SMA) confluence surrounding 110.60 can lure the bulls.
USD/JPY daily chart
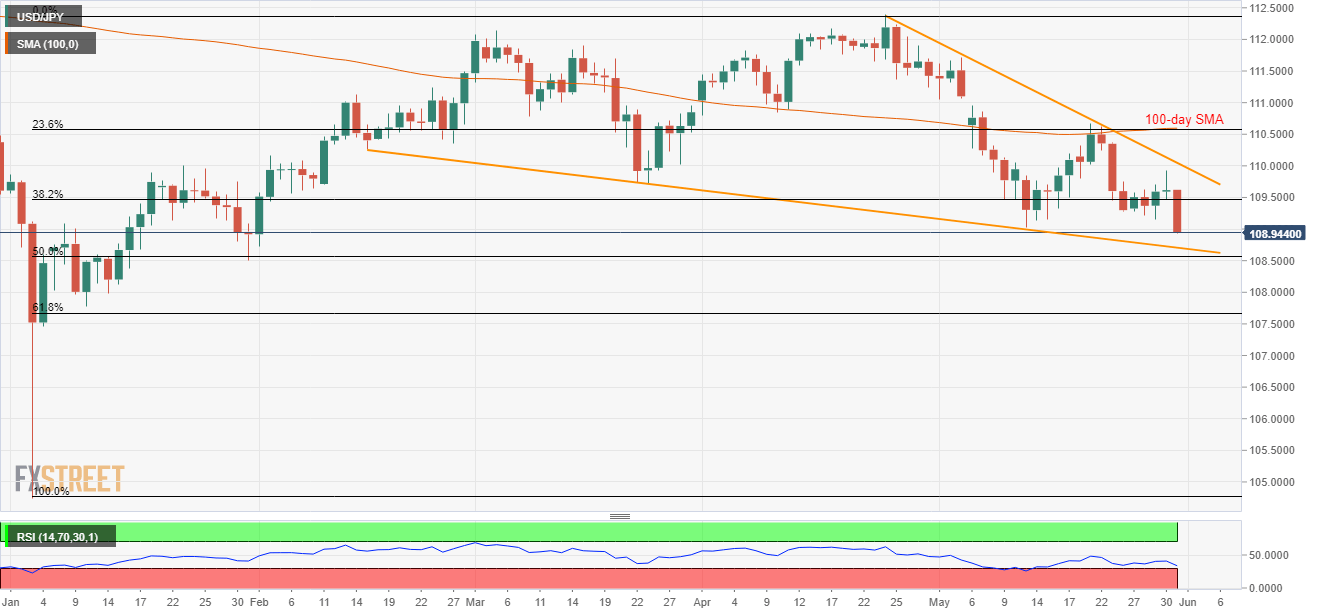
Trend: Bearish
Author

Anil Panchal
FXStreet
Anil Panchal has nearly 15 years of experience in tracking financial markets. With a keen interest in macroeconomics, Anil aptly tracks global news/updates and stays well-informed about the global financial moves and their implications.


