USD/JPY Technical Analysis: 50-DMA questions break of two-month-old rising trendline
- Break of short-term support line, now resistance, drags USD/JPY to eight days’ low.
- 23.6% Fibonacci retracement adds strength to the support.
- 200-DMA offers additional resistance beyond the trend line.

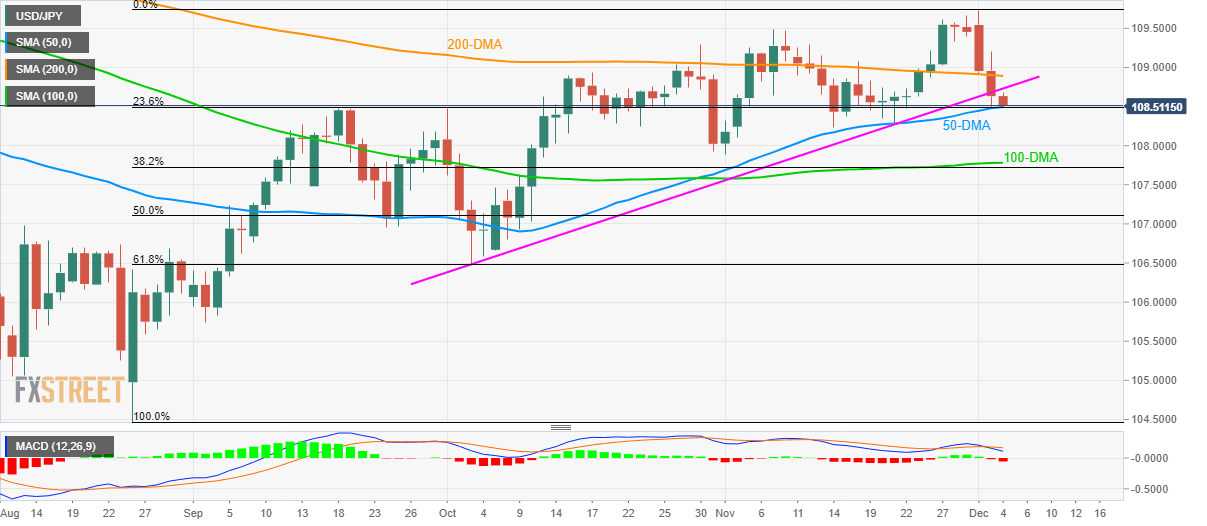
USD/JPY drops to 108.50 during early Wednesday. That said, the pair nears multi-day low after breaking a two-month-old rising trend line during the previous day.
Currently, 50-Day Simple Moving Average (DMA) and 23.6% Fibonacci retracement of its rise since August restrict the pair’s immediate declines around 108.50.
Though, bearish signals from 12-bar Moving Average Convergence and Divergence (MACD) push the sellers to watch over 107.80/70 area, comprising 100-DMA and 38.2% Fibonacci retracement, in a case of the pair’s declines below 108.50.
If prices bounce back beyond support-turned-resistance line around 108.75/80, 200-DMA at 108.90 and early-November top surrounding 109.50 can offer intermediate halts to the quote’s run-up towards the monthly high near 109.75 and 110.00 afterward.
USD/JPY daily chart
Trend: Pullback expected
Author

Anil Panchal
FXStreet
Anil Panchal has nearly 15 years of experience in tracking financial markets. With a keen interest in macroeconomics, Anil aptly tracks global news/updates and stays well-informed about the global financial moves and their implications.


