|

USD/JPY holds below 113.00, multi-week low performance, US CPI eyed

  • The risk-off sentiment undervalued JPY's safe-haven appeal.
  • USD/JPY weighed heavily on the back of Japan's real wages decline, report.
  • The pair look for impetus from US CPI amid a light economic calendar.  

USD/JPY is trading under the 113.00 mark during early Asian session hours on Wednesday. The pair pushed lower alongside commodity currencies as risk appetite reversed overnight. As of now, a tight currency range is expected in the near term as markets look ahead to US CPI.

After falling from the 114.00 level, Japan's Current Account balance shrank below the ¥1060B forecast to ¥1033.7B in September, which weighed on the USD/JPY prices.

Also, in the news, Japan being the world's third-largest economy hit hard by the coronavirus pandemic, Prime Minister Fumio Kishida is set to map out and secure funding for a stimulus package worth more than 30 trillion yen ($265 billion) within the year. 

It is to be noted that Reuters reported that "Japan's real wages declined in September for the first time in three months as inflation picked up faster than growth in nominal pay, the government said''. The news agency said that this is a sign of global cost-push inflation starting to affect Japanese households. This information has weighed heavy on the quote's price action. 

Meanwhile, the US dollar index is moving below 94.00, down by 0.09% on the day. Treasury yields fell across the curve as markets digested news that dovish Fed Governor Lael Brainard has been interviewed for the Fed's chair position. This should see local rates markets open to a bid tone.  

Amid a light economic docket in Japan, the pair will find impetus from the critical US inflation figures.
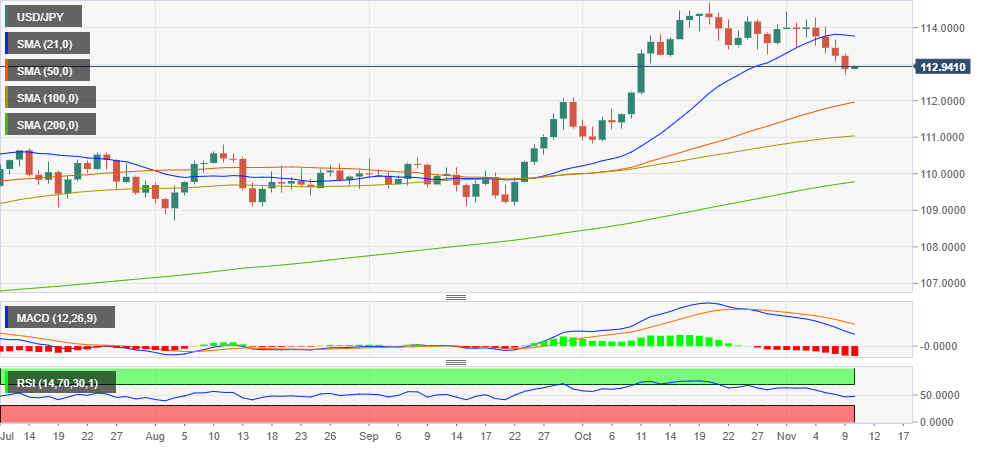
Technical levels

The USD/JPY daily chart indicates 113.76, 21-day Simple Moving Average (SMA), as immediate resistance to the upside. If it's breached, the pair's one-week high of 114.44 will be the next topside barrier. The next resistance would be one month's high at 114.70.  

The price may reverse and continue the downtrend towards the support levels of 111.96, 110.03 and 109.78, which are the pair's 50, 100 and 200-day SMAs respectively. Following the Moving Average Convergence Divergence (MACD), the movement shows a cautious dive. The Relative Strength Index (RSI) looks cheerful but manages to stay below the 50-line horizon.


Overview
Today last price112.88
Today Daily Change0.01
Today Daily Change %0.01
Today daily open112.87
 
Trends
Daily SMA20113.81
Daily SMA50111.9
Daily SMA100111.02
Daily SMA200109.74
 
Levels
Previous Daily High113.29
Previous Daily Low112.73
Previous Weekly High114.44
Previous Weekly Low113.3
Previous Monthly High114.7
Previous Monthly Low110.82
Daily Fibonacci 38.2%112.94
Daily Fibonacci 61.8%113.08
Daily Pivot Point S1112.63
Daily Pivot Point S2112.4
Daily Pivot Point S3112.07
Daily Pivot Point R1113.2
Daily Pivot Point R2113.53
Daily Pivot Point R3113.76

Author

Sounava Ray Sarkar

Sounava Ray Sarkar

Independent Analyst

Sounava has been working as a Journalist since 2012. He has worked with several reputed media organizations in various capacities before settling as a writer and news editor for business and technology segments.

More from Sounava Ray Sarkar
Share:

Markets move fast. We move first.

Orange Juice Newsletter brings you expert driven insights - not headlines. Every day on your inbox.

By subscribing you agree to our Terms and conditions.

Editor's Picks

EUR/USD recovers to 1.1750 region as 2025 draws to a close

Following the bearish action seen in the European session on Wednesday, EUR/USD regains its traction and recovery to the 1.1750 region. Nevertheless, the pair's volatility remains low as trading conditions thin out on the last day of the year.

GBP/USD stays weak near 1.3450 on modest USD recovery

GBP/USD remains under modest beairsh pressure and fluctuates at around 1.3450 on Wednesday. The US Dollar finds fresh demand due to the end-of-the-year position adjustments, weighing on the pair amid the pre-New Year trading lull. 

Gold climbs to near $4,350 on Fed rate cut bets, geopolitical risks

Gold price rises to near $4,345 during the early Asian session on Friday. Gold finished 2025 with a significant rally, achieving an annual gain of around 65%, its biggest annual gain since 1979. The rally of the precious metal is bolstered by the prospect of further US interest rate cuts in 2026 and safe-haven flows.

Bitcoin, Ethereum and XRP prepare for a potential New Year rebound

Bitcoin, Ethereum, and Ripple are holding steady on Wednesday after recording minor gains on the previous day. Technically, Bitcoin could extend gains within a triangle pattern while Ethereum and Ripple face critical overhead resistance. 

Economic outlook 2026-2027 in advanced countries: Solidity test

After a year marked by global economic resilience and ending on a note of optimism, 2026 looks promising and could be a year of solid economic performance. In our baseline scenario, we expect most of the supportive factors at work in 2025 to continue to play a role in 2026.

Crypto market outlook for 2026

Year 2025 was volatile, as crypto often is.  Among positive catalysts were favourable regulatory changes in the U.S., rise of Digital Asset Treasuries (DAT), adoption of AI and tokenization of Real-World-Assets (RWA).