USD/JPY Price Forecast: Climbs above 147.00 as bulls target Kumo
- USD/JPY rises above 147 for the first time since September, driven by escalating Middle East tensions.
- Bullish RSI signals further upside potential, with buyers eyeing resistance at 147.25, followed by 147.78 and 148.00.
- A reversal could see USD/JPY testing support at the 50-DMA of 145.38, with further downside risk at 145.00 and 143.93.

The USD/JPY edges higher on Thursday, climbs above 147.00 for the first time since September, trades at 146.92 and gains 0.31% at the time of writing. The financial markets narrative hasn’t changed, as traders hear war drums beating, as the Middle East conflict escalates, triggering a flow to haven currencies, boosting the Greenback.
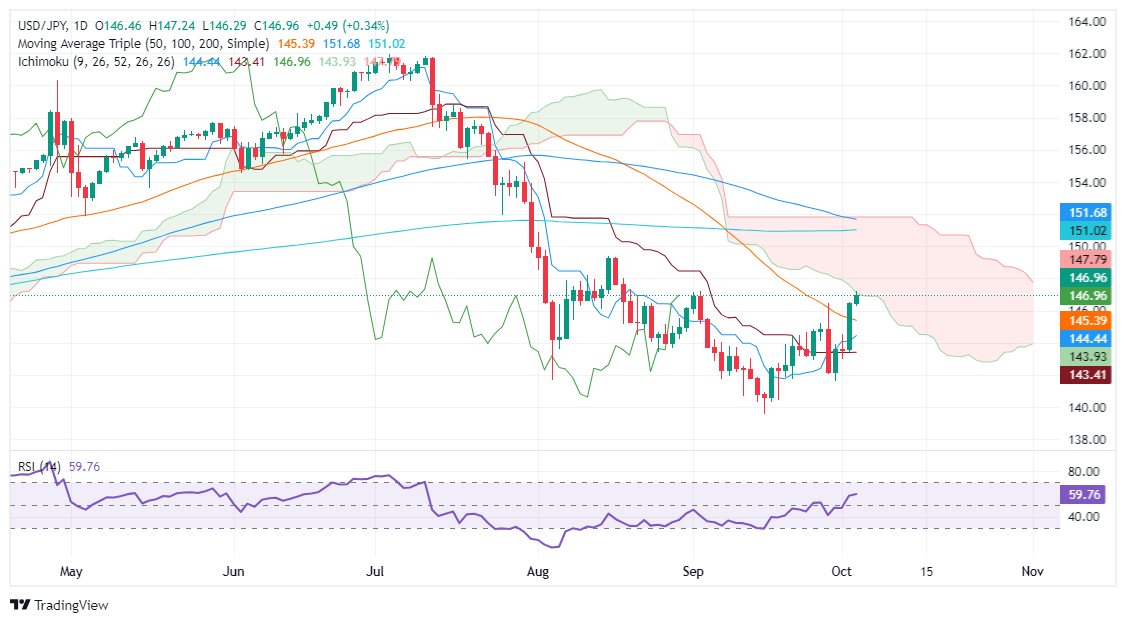
USD/JPY Price Forecast: Technical outlook
The USD/JPY daily chart is neutral to downward biased, as buyers tested the bottom of the Ichimoku Cloud (Kumo) at 147.25. Momentum hints that buyers remain in charge, and might push prices higher.
The Relative Strength Index (RSI) is bullish, aiming to the upside. This means, the USD/JPY is tilted to the upside, in the near-term.
The USD/JPY must clear the top of the Kumo at 147.25. In that outcome, the next resistance would be the Senkou Span B at 147.78, followed by 148.00. If those levels are cleared, the 200-day moving average (DMA) would be next at 151.02.
Conversely, if the pair reverses its course, the first support would be the 50-DMA at 145.38. Once surpassed, the next stop would be the 145.00 figure, followed by the Senkou Span A at 143.93.
USD/JPY Price Action – Daily Chart
Japanese Yen PRICE Today
The table below shows the percentage change of Japanese Yen (JPY) against listed major currencies today. Japanese Yen was the strongest against the British Pound.
| USD | EUR | GBP | JPY | CAD | AUD | NZD | CHF | |
|---|---|---|---|---|---|---|---|---|
| USD | 0.14% | 1.10% | 0.34% | 0.40% | 0.65% | 0.83% | 0.37% | |
| EUR | -0.14% | 0.97% | 0.19% | 0.24% | 0.51% | 0.67% | 0.23% | |
| GBP | -1.10% | -0.97% | -0.75% | -0.72% | -0.45% | -0.29% | -0.71% | |
| JPY | -0.34% | -0.19% | 0.75% | 0.07% | 0.31% | 0.46% | 0.03% | |
| CAD | -0.40% | -0.24% | 0.72% | -0.07% | 0.25% | 0.43% | -0.02% | |
| AUD | -0.65% | -0.51% | 0.45% | -0.31% | -0.25% | 0.16% | -0.26% | |
| NZD | -0.83% | -0.67% | 0.29% | -0.46% | -0.43% | -0.16% | -0.43% | |
| CHF | -0.37% | -0.23% | 0.71% | -0.03% | 0.02% | 0.26% | 0.43% |
The heat map shows percentage changes of major currencies against each other. The base currency is picked from the left column, while the quote currency is picked from the top row. For example, if you pick the Japanese Yen from the left column and move along the horizontal line to the US Dollar, the percentage change displayed in the box will represent JPY (base)/USD (quote).
Author

Christian Borjon Valencia
FXStreet
Markets analyst, news editor, and trading instructor with over 14 years of experience across FX, commodities, US equity indices, and global macro markets.


