|

USD/JPY Price Analysis: Weekly triangle advocates volatility expansion, 128.50 is the key

  • USD/JPY holds lower ground as bears keep the reins for the third consecutive day.
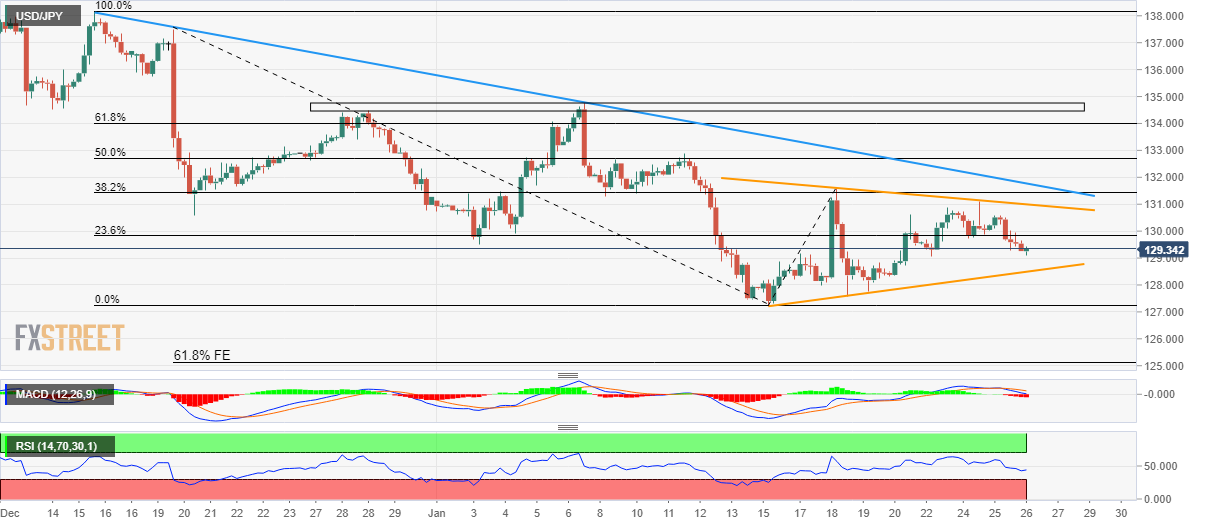
  • One-week-old symmetrical triangle restricts immediate moves.
  • Downbeat RSI, bearish MACD signals favor sellers to refresh multi-month low.
  • Buyers need validation from six-week-old descending trend line to retake control.

USD/JPY licks its wounds around 129.40 as it seesaws near an intraday low during early Thursday. In doing so, the Yen pair consolidates the latest losses as a two-day losing streak.

Even so, the quote prints mild losses while staying inside a one-week-old symmetrical triangle, between 128.50 and 131.00 by the press time.

That said, the bearish MACD signals join the downward-sloping RSI (14) line to keep USD/JPY sellers hopeful. Also challenging the Yen pair buyers could be a descending resistance line from mid-December 2022, close to 131.80.

It should be noted that the 50% Fibonacci retracement level of the pair’s December 15 to January 16 downtrend, near 132.70, precedes the one-month-long horizontal resistance area around 134.50-75 to challenge the pair’s further upside.

On the flip side, a clear break of the stated triangle’s support, close to 128.50, becomes necessary for the USD/JPY seller’s conviction.

Following that, the monthly low surrounding 127.20, also the lowest level in eight months, could probe the Yen pair bears before directing them to the 61.8% Fibonacci Expansion (FE) of the quote’s moves between December 20 and January 18, around 125.20.

Overall, USD/JPY is funneling down towards a breakout point and hints at volatility expansion moving forward.

USD/JPY: Four-hour chart

Trend: Further downside expected

Additional important levels

Overview
Today last price129.4
Today Daily Change-0.20
Today Daily Change %-0.15%
Today daily open129.6
 
Trends
Daily SMA20130.59
Daily SMA50134.24
Daily SMA100139.73
Daily SMA200136.75
 
Levels
Previous Daily High130.58
Previous Daily Low129.27
Previous Weekly High131.58
Previous Weekly Low127.22
Previous Monthly High138.18
Previous Monthly Low130.57
Daily Fibonacci 38.2%129.77
Daily Fibonacci 61.8%130.08
Daily Pivot Point S1129.05
Daily Pivot Point S2128.5
Daily Pivot Point S3127.73
Daily Pivot Point R1130.37
Daily Pivot Point R2131.13
Daily Pivot Point R3131.68

Author

Anil Panchal

Anil Panchal

FXStreet

Anil Panchal has nearly 15 years of experience in tracking financial markets. With a keen interest in macroeconomics, Anil aptly tracks global news/updates and stays well-informed about the global financial moves and their implications.

More from Anil Panchal
Share:

Editor's Picks

GBP/USD rebounds above 1.3200 as USD loses traction

GBP/USD starts the week on a bullish note and advances toward 1.3250 on Monday. The pair recovers ground as the US Dollar uptrend falters and traders resort to profit-taking ahead of Tuesday's US-Iran peace talks and Fed Chair Kevin Warsh's appearance on Wednesday at the ECB Forum.

EUR/USD clings to modest gains near 1.1400

EUR/USD gains traction on Monday and trades moderately higher on the day above 1.1400, helped by a broadly weaker US Dollar. Traders continue to assess the developments surrounding talks to end the US war with Iran. The European Central Bank's annual forum and the US June employment data will be the highlights later this week.

Gold stays in red near $4,050 as US-Iran clash revives inflation fears

Gold price remains in the negative territory around $4,050 in Monday's European trading. The bullion struggles as military clashes between the United States and Iran in the strategic Strait of Hormuz have revived inflation concerns, bolstering Fed rate hike expectations. However, a broad US Dollar retreat is helping limit Gold's downside.

Bitcoin four-year cycle: BTC risks 75% drawdown with four months of bear market still ahead

Bitcoin price continues to trend downward below the $60,000 support zone after losing over 50% of its value since the $126,199 high in October. Bitcoin’s four-year cycle, measured from cycle tops to bottoms, suggests that four months of a bear market are still ahead.

Just like Fed, is BoJ’s independence under threat?

When talking about central bank independence, most of the focus has been on Donald Trump’s pressure on the Federal Reserve. But a similar story, a quieter one for now, seems to be happening on the other side of the Pacific: Japan’s government may be testing the Bank of Japan’s independence.

Regime change: Inside Kevin Warsh's first move to make the Fed unreadable on purpose

The rate did not move. That was the least interesting thing about Kevin Warsh's first meeting in charge of the Fed. The FOMC held its benchmark at 3.50%-3.75% for the fourth straight meeting, exactly as priced, and then the new chair used his first press conference to dismantle the machinery the market has leaned on for a decade.