|

USD/JPY Price Analysis: Treads water inside 40-pip trading range near 149.00

  • USD/JPY remains indecisive after a volatile start to the week.
  • Immediate resistance line joins previous support from late September to restrict nearby moves.
  • Sustained trading above the key SMAs, the receding bearish bias of MACD keeps buyers hopeful.

USD/JPY holds onto the day-start inaction around 149.00 as European traders brace for Tuesday’s work. In doing so, the yen pair remains inside a 40-pip trading area established after a rollercoaster start to the week.

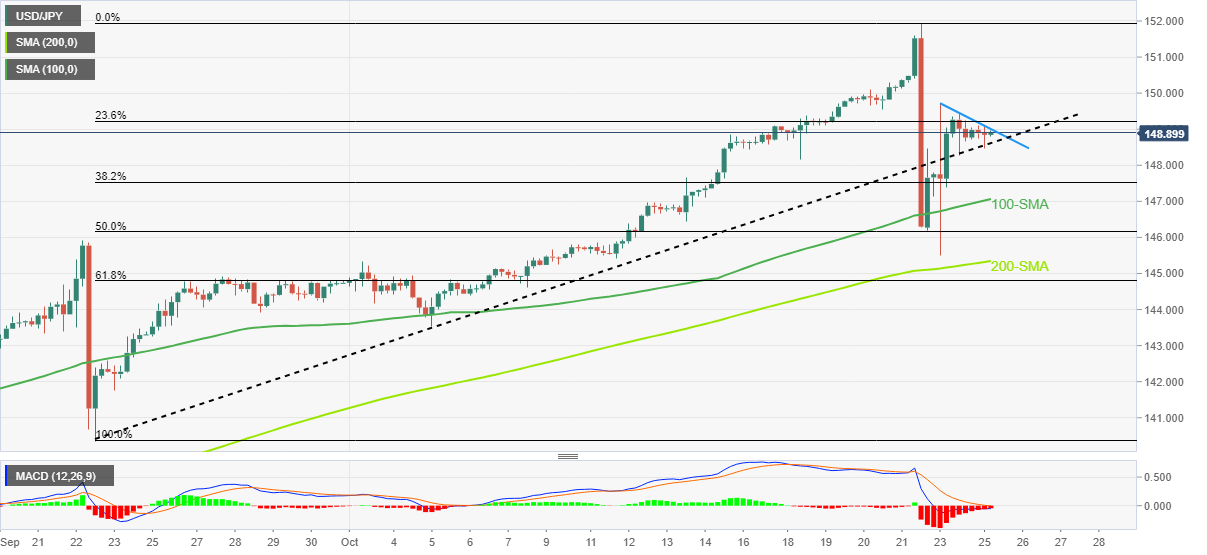
That said, the support-turned-resistance line from September 22, around 149.00 by the press time, restricts the yen pair’s immediate downside. Alternatively, a descending trend line joining the quote’s retreat from early Monday’s peak, near 148.60, acts as the adjacent resistance.

It’s worth noting that the USD/JPY remains well above the key moving averages and has been getting less bearish signals from the MACD of late, which in turn suggests the quote’s run-up towards the 150.00 threshold.

Following that, the recently flashed 32-year high near 152.00 and June 1990 peak surrounding 155.80 will be in focus.

Alternatively, a downside break of 148.60 could drag the USD/JPY prices toward the 100-SMA and 200-SMA, respectively near 147.00 and 145.30.

If the quote drops below 145.30, the 61.8% Fibonacci retracement level of the pair’s run-up between September 22 and October 21, close to 144.80, could act as the last defense of the bulls.

Overall, USD/JPY remains on the buyer’s radar but the short-term moves appear less impressive.

USD/JPY: Four-hour chart

Trend: Further recovery expected

Additional important levels

Overview
Today last price148.88
Today Daily Change-0.03
Today Daily Change %-0.02%
Today daily open148.91
 
Trends
Daily SMA20146.55
Daily SMA50142.95
Daily SMA100139.15
Daily SMA200130.52
 
Levels
Previous Daily High149.71
Previous Daily Low145.51
Previous Weekly High151.94
Previous Weekly Low146.19
Previous Monthly High145.9
Previous Monthly Low138.78
Daily Fibonacci 38.2%148.1
Daily Fibonacci 61.8%147.11
Daily Pivot Point S1146.37
Daily Pivot Point S2143.84
Daily Pivot Point S3142.17
Daily Pivot Point R1150.58
Daily Pivot Point R2152.24
Daily Pivot Point R3154.78

Author

Anil Panchal

Anil Panchal

FXStreet

Anil Panchal has nearly 15 years of experience in tracking financial markets. With a keen interest in macroeconomics, Anil aptly tracks global news/updates and stays well-informed about the global financial moves and their implications.

More from Anil Panchal
Share:

Markets move fast. We move first.

Orange Juice Newsletter brings you expert driven insights - not headlines. Every day on your inbox.

By subscribing you agree to our Terms and conditions.

Editor's Picks

EUR/USD declines toward 1.1700 on solid USD recovery

EUR/USD turns south and declines toward 1.1700 on Wednesday. A solid comeback staged by the US Dollar weighs heavily on the pair, as traders look to USD short covering ahead of US CPI on Thursday. However, the downside could be capped by hawkish ECB expectations. 

GBP/USD slides toward 1.3300 after softer-than-expected UK inflation data

GBP/USD has come under intense selling pressure, eyeing 1.3300 in the European session on Wednesday. The UK annual headline and core CPI rose by 3.2% each, missing estimates of 3.5% and 3.4%, respectively, reaffirming dovish BoE expectations and smashing the Pound Sterling across the board. 

Gold clings to modest gains above $4,300

Following Tuesday's volatile action, Gold regains its traction on Wednesday and trades in positive territory above $4,300. While the buildup in the USD recovery momentum caps XAU/USD's upside, the cautious market stance helps ithe pair hold its ground.

Bitcoin, Ethereum and Ripple extend correction as bearish momentum builds

Bitcoin, Ethereum, and Ripple remain under pressure as the broader market continues its corrective phase into midweek. The weak price action of these top three cryptocurrencies by market capitalization suggests a deeper correction, as momentum indicators are beginning to tilt bearish.

Ukraine-Russia in the spotlight once again

Since the start of the week, gold’s price has moved lower, but has yet to erase the gains made last week. In today’s report we intend to focus on the newest round of peace talks between Russia and Ukraine, whilst noting the release of the US Employment data later on day and end our report with an update in regards to the tensions brewing in Venezuela.

AAVE slips below $186 as bearish signals outweigh the SEC investigation closure

Aave (AAVE) price continues its decline, trading below $186 at the time of writing on Wednesday after a rejection at the key resistance zone. Derivatives positioning and momentum indicators suggest that bearish forces still dominate in the near term.