USD/JPY Price Analysis: Sinks to five-month lows fueled by reignited US recession fears


  • USD/JPY falls to 146.41, lowest since March, amid worse-than-expected US economic data.
  • Technical outlook: Strong support at 146.48; a close below targets 146.00, 145.50, and 145.00 levels.
  • RSI indicates potential for upward correction; resistance at 147.00 and cycle low at 151.86 if buyers regain control.

The USD/JPY collapsed to a five-month low of 146.41 on Friday following the release of worse-than-expected US economic data that increased the odds for a Federal Reserve cut at the September meeting. Hence, the US 10-year Treasury bond yield, closely correlated to this pair, tumbled sharply below the 4% threshold, while the major dropped after hitting a daily high of 149.77.  At the time of writing, the pair exchanges hands at 146.62, down by more than 1.80%.

USD/JPY Price Analysis: Technical outlook

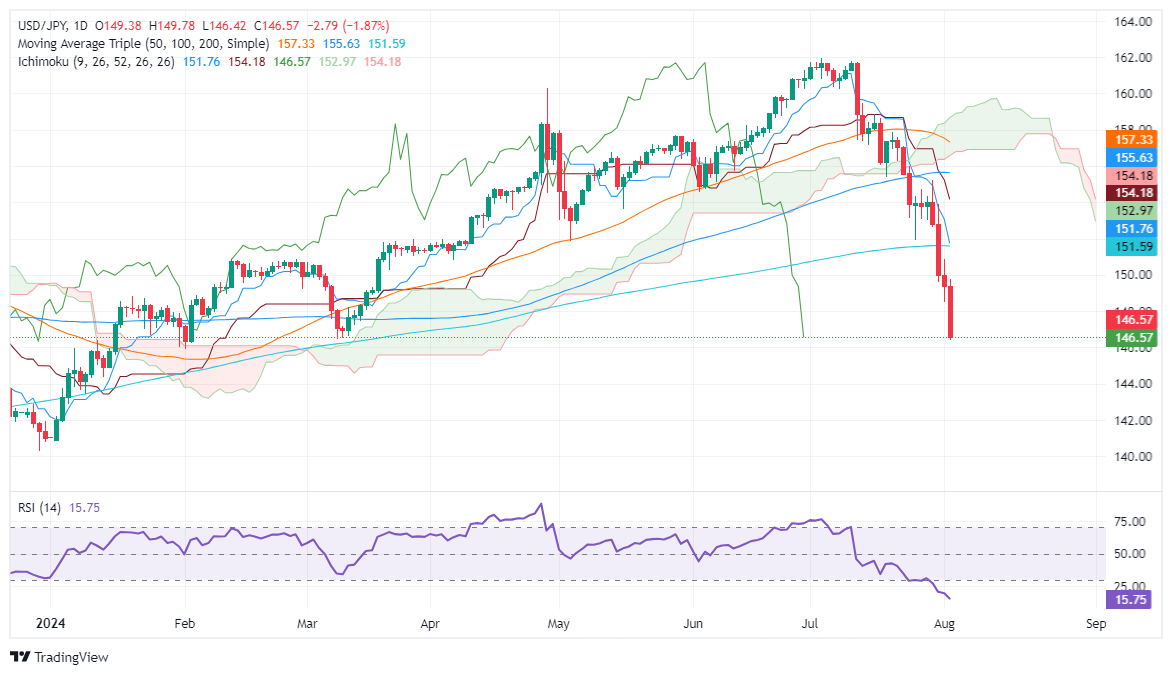
After clearing key support levels, the USD/JPY is set to test lower prices, though it faces strong support at the March 11 pivot low of 146.48. Sellers will need to push the spot price below the latter so they have the chance to test lower prices.

The Relative Strength Index (RSI) suggests that prices are overextended, which could lead to an upward correction in USD/JPY.

For a bearish continuation, sellers need a daily close below 146.48. Once achieved, the next support would be the 146.00 figure, followed by the 145.50. A further downside lies at the 145.00 mark

On the other hand, if buyers lift the exchange rate past 147.00, they could threaten to push the spot price above until they can face the latest cycle low turned resistance located at 151.86.  

USD/JPY Price Action – Daily Chart

Japanese Yen PRICE Today

The table below shows the percentage change of Japanese Yen (JPY) against listed major currencies today. Japanese Yen was the strongest against the US Dollar.

  USD EUR GBP JPY CAD AUD NZD CHF
USD   -1.14% -0.56% -1.88% -0.10% -0.27% -0.28% -1.62%
EUR 1.14%   0.58% -0.74% 1.04% 0.88% 0.86% -0.48%
GBP 0.56% -0.58%   -1.33% 0.47% 0.28% 0.29% -1.04%
JPY 1.88% 0.74% 1.33%   1.83% 1.64% 1.62% 0.28%
CAD 0.10% -1.04% -0.47% -1.83%   -0.17% -0.16% -1.50%
AUD 0.27% -0.88% -0.28% -1.64% 0.17%   0.00% -1.35%
NZD 0.28% -0.86% -0.29% -1.62% 0.16% -0.01%   -1.32%
CHF 1.62% 0.48% 1.04% -0.28% 1.50% 1.35% 1.32%  

The heat map shows percentage changes of major currencies against each other. The base currency is picked from the left column, while the quote currency is picked from the top row. For example, if you pick the Japanese Yen from the left column and move along the horizontal line to the US Dollar, the percentage change displayed in the box will represent JPY (base)/USD (quote).


Share: Feed news

Information on these pages contains forward-looking statements that involve risks and uncertainties. Markets and instruments profiled on this page are for informational purposes only and should not in any way come across as a recommendation to buy or sell in these assets. You should do your own thorough research before making any investment decisions. FXStreet does not in any way guarantee that this information is free from mistakes, errors, or material misstatements. It also does not guarantee that this information is of a timely nature. Investing in Open Markets involves a great deal of risk, including the loss of all or a portion of your investment, as well as emotional distress. All risks, losses and costs associated with investing, including total loss of principal, are your responsibility. The views and opinions expressed in this article are those of the authors and do not necessarily reflect the official policy or position of FXStreet nor its advertisers. The author will not be held responsible for information that is found at the end of links posted on this page.

If not otherwise explicitly mentioned in the body of the article, at the time of writing, the author has no position in any stock mentioned in this article and no business relationship with any company mentioned. The author has not received compensation for writing this article, other than from FXStreet.

FXStreet and the author do not provide personalized recommendations. The author makes no representations as to the accuracy, completeness, or suitability of this information. FXStreet and the author will not be liable for any errors, omissions or any losses, injuries or damages arising from this information and its display or use. Errors and omissions excepted.

The author and FXStreet are not registered investment advisors and nothing in this article is intended to be investment advice.

XM
Account
7.2
Tools
9.2
Service
9.4
Trading
9.0
Trust
7.0
Experience
8.4
Read review
Moneta Markets
Account
7.4
Tools
6.6
Service
8.0
Trading
6.6
Trust
5.2
Experience
9.2
Read review
Trading Pro
Account
7.2
Tools
5.2
Service
6.6
Trading
8.0
Trust
5.0
Experience
7.0
Read review
Pepperstone
Account
8.2
Tools
8.2
Service
7.4
Trading
9.0
Trust
8.8
Experience
9.0
Read review
XM
Read review
Moneta Markets
Read review
Trading Pro
Read review
Pepperstone
Read review
Trading Pro
Read review
Pepperstone
Read review
XM
Read review
Moneta Markets
Read review
Trading Pro
Account
7.2
Tools
5.2
Service
6.6
Trading
8.0
Trust
5.0
Experience
7.0
Read review
Pepperstone
Account
8.2
Tools
8.2
Service
7.4
Trading
9.0
Trust
8.8
Experience
9.0
Read review
XM
Account
7.2
Tools
9.2
Service
9.4
Trading
9.0
Trust
7.0
Experience
8.4
Read review
Moneta Markets
Account
7.4
Tools
6.6
Service
8.0
Trading
6.6
Trust
5.2
Experience
9.2
Read review

Recommended content


Recommended content

Editors’ Picks

EUR/USD accelerates losses to 1.0930 on stronger Dollar

EUR/USD accelerates losses to 1.0930 on stronger Dollar

The US Dollar's recovery regains extra impulse sending the US Dollar Index to fresh highs and relegating EUR/USD to navigate the area of daily troughs around 1.0930 in the latter part of Friday's session.

EUR/USD News
GBP/USD plummets to four-week lows near 1.2850

GBP/USD plummets to four-week lows near 1.2850

The US Dollar's rebound keep gathering steam and now sends GBP/USD to the area of multi-week lows in the 1.2850 region amid the broad-based pullback in the risk-associated universe.

GBP/USD News
Gold trades on the back foot, flirts with $3,000

Gold trades on the back foot, flirts with $3,000

Gold prices are accelerating their daily decline, steadily approaching the critical $3,000 per troy ounce mark as the Greenback's rebound gains extra momentum and US yields tighten their retracement.

Gold News
Can Maker break $1,450 hurdle as whales launch buying spree?

Can Maker break $1,450 hurdle as whales launch buying spree?

Maker holds steadily above $1,250 support as a whale scoops $1.21 million worth of MKR. Addresses with a 100k to 1 million MKR balance now account for 24.27% of Maker’s total supply. Maker battles a bear flag pattern as bulls gather for an epic weekend move.

Read more
Strategic implications of “Liberation Day”

Strategic implications of “Liberation Day”

Liberation Day in the United States came with extremely protectionist and inward-looking tariff policy aimed at just about all U.S. trading partners. In this report, we outline some of the more strategic implications of Liberation Day and developments we will be paying close attention to going forward.

Read more
The Best brokers to trade EUR/USD

The Best brokers to trade EUR/USD

SPONSORED Discover the top brokers for trading EUR/USD in 2025. Our list features brokers with competitive spreads, fast execution, and powerful platforms. Whether you're a beginner or an expert, find the right partner to navigate the dynamic Forex market.

Read More

Forex MAJORS

Cryptocurrencies

Signatures

Best Brokers of 2025