USD/JPY Price Analysis: Rising wedge at multi-day top keeps Yen buyers hopeful near 138.50


  • USD/JPY portrays bearish chart formation at the highest levels in six months.
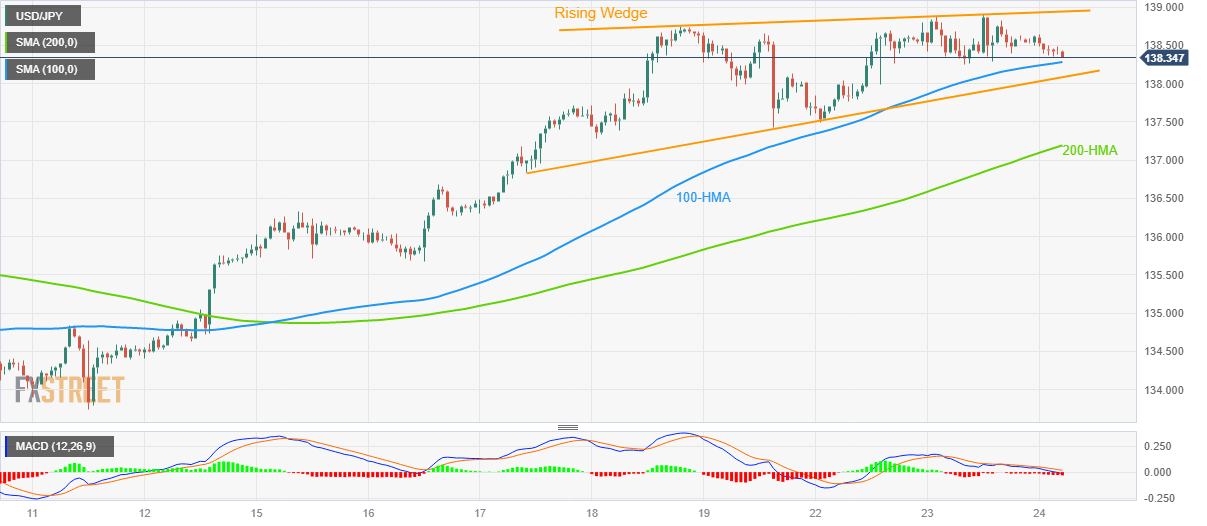
  • Downbeat MACD signals also lure Yen pair bears, 100-HMA, 200-HMA act as extra checks for sellers.
  • Bulls need validation from 139.40 to retake control.

USD/JPY grinds lower past 139.00, mildly offered near 138.40 heading into Wednesday’s European session.

The Yen pair rose to a fresh high since November 2022 before posting an unimpressive closing the previous day. In doing so, the major currency pair portrays a one-week-old rising wedge bearish chart formation.

Not only the bearish pattern but the downbeat MACD signals and failure to remain firmer at the multi-day high also lures the USD/JPY sellers.

However, the 100-Hour Moving Average (HMA) level of around 138.30 restricts the immediate downside of the Yen pair, a break of which highlights the stated wedge’s confirmation point, namely the lower line surrounding 138.00.

Following that, a quick fall towards the 200-HMA surrounding 137.20 can’t be ruled out. It should be noted, however, that the rising wedge confirmation hints at the 136.00 round figure as a theoretical target.

Alternatively, the stated wedge’s top line, close to the 139.00 round figure by the press time, restricts immediate USD/JPY recovery. Also likely to challenge the Yen pair buyers is the July 2022 high of near 139.40.

Even if the Yen pair manage to cross the 139.40 hurdle, the 140.00 round figure may prod the buyers.

Overall, USD/JPY bulls appear to run out of steam but the sellers wait for clear signals.

USD/JPY: Hourly chart

Trend: Pullback expected

Additional important levels

Overview
Today last price 138.43
Today Daily Change -0.15
Today Daily Change % -0.11%
Today daily open 138.58
 
Trends
Daily SMA20 136.03
Daily SMA50 134.06
Daily SMA100 133.29
Daily SMA200 137.17
 
Levels
Previous Daily High 138.91
Previous Daily Low 138.24
Previous Weekly High 138.75
Previous Weekly Low 135.65
Previous Monthly High 136.56
Previous Monthly Low 130.63
Daily Fibonacci 38.2% 138.5
Daily Fibonacci 61.8% 138.66
Daily Pivot Point S1 138.25
Daily Pivot Point S2 137.91
Daily Pivot Point S3 137.58
Daily Pivot Point R1 138.91
Daily Pivot Point R2 139.25
Daily Pivot Point R3 139.58


Share: Feed news

Information on these pages contains forward-looking statements that involve risks and uncertainties. Markets and instruments profiled on this page are for informational purposes only and should not in any way come across as a recommendation to buy or sell in these assets. You should do your own thorough research before making any investment decisions. FXStreet does not in any way guarantee that this information is free from mistakes, errors, or material misstatements. It also does not guarantee that this information is of a timely nature. Investing in Open Markets involves a great deal of risk, including the loss of all or a portion of your investment, as well as emotional distress. All risks, losses and costs associated with investing, including total loss of principal, are your responsibility. The views and opinions expressed in this article are those of the authors and do not necessarily reflect the official policy or position of FXStreet nor its advertisers. The author will not be held responsible for information that is found at the end of links posted on this page.

If not otherwise explicitly mentioned in the body of the article, at the time of writing, the author has no position in any stock mentioned in this article and no business relationship with any company mentioned. The author has not received compensation for writing this article, other than from FXStreet.

FXStreet and the author do not provide personalized recommendations. The author makes no representations as to the accuracy, completeness, or suitability of this information. FXStreet and the author will not be liable for any errors, omissions or any losses, injuries or damages arising from this information and its display or use. Errors and omissions excepted.

The author and FXStreet are not registered investment advisors and nothing in this article is intended to be investment advice.

Recommended content


Recommended content

Editors’ Picks

AUD/USD loses ground due to the absence of a hawkish RBA

AUD/USD loses ground due to the absence of a hawkish RBA

The Australian Dollar has plunged following the Reserve Bank of Australia's decision to maintain its interest rate at 4.35% on Tuesday. Investors sentiment leaned toward a potentially more hawkish stance from the RBA, particularly after last week's inflation data surpassed expectations.

AUD/USD News

EUR/USD edges lower to near 1.0750 after hawkish remarks from a Fed official

EUR/USD edges lower to near 1.0750 after hawkish remarks from a Fed official

EUR/USD extends its losses for the second successive session, trading around 1.0750 during the Asian session on Wednesday. The US Dollar gains ground due to the expectations of the Federal Reserve’s prolonging higher interest rates.

EUR/USD News

Gold price remains on the defensive on a firmer US Dollar

Gold price remains on the defensive on a firmer US Dollar

Gold price attracts some sellers on the firmer US Dollar during the Asian trading hours on Wednesday. The hawkish remarks from Federal Reserve officials dampen hopes for potential interest rate cuts in 2024 despite weaker-than-expected US employment reports in April.

Gold News

FTX files consensus-based plan of reorganization, awaits bankruptcy court approval

FTX files consensus-based plan of reorganization, awaits bankruptcy court approval

FTX has filed a consensus-based plan for its reorganization, coming almost two years after the now defunct FTX filed for Chapter 11 Bankruptcy Protection in the District of Delaware.

Read more

Living vicariously through rate cut expectations

Living vicariously through rate cut expectations

U.S. stock indexes made gains on Tuesday as concerns about an overheating U.S. economy ease, particularly with incoming economic reports showing data surprises at their most negative levels since February of last year. 

Read more

Forex MAJORS

Cryptocurrencies

Signatures