|

USD/JPY Price Analysis: Reaches top of channel, primed to fall

  • USD/JPY has touched the top of a multi-year rising channel. 
  • It is likely to face increased resistance and is at increased risk of pulling back. 
  • RSI is threatening to exit overbought and a Hanging Man candlestick pattern bodes ill.
     

USD/JPY has reached the top of a rising channel it has been in since the start of 2023. Although it is in an uptrend on all timeframes there is a growing risk it is about to correct back.

USD/JPY Daily Chart 


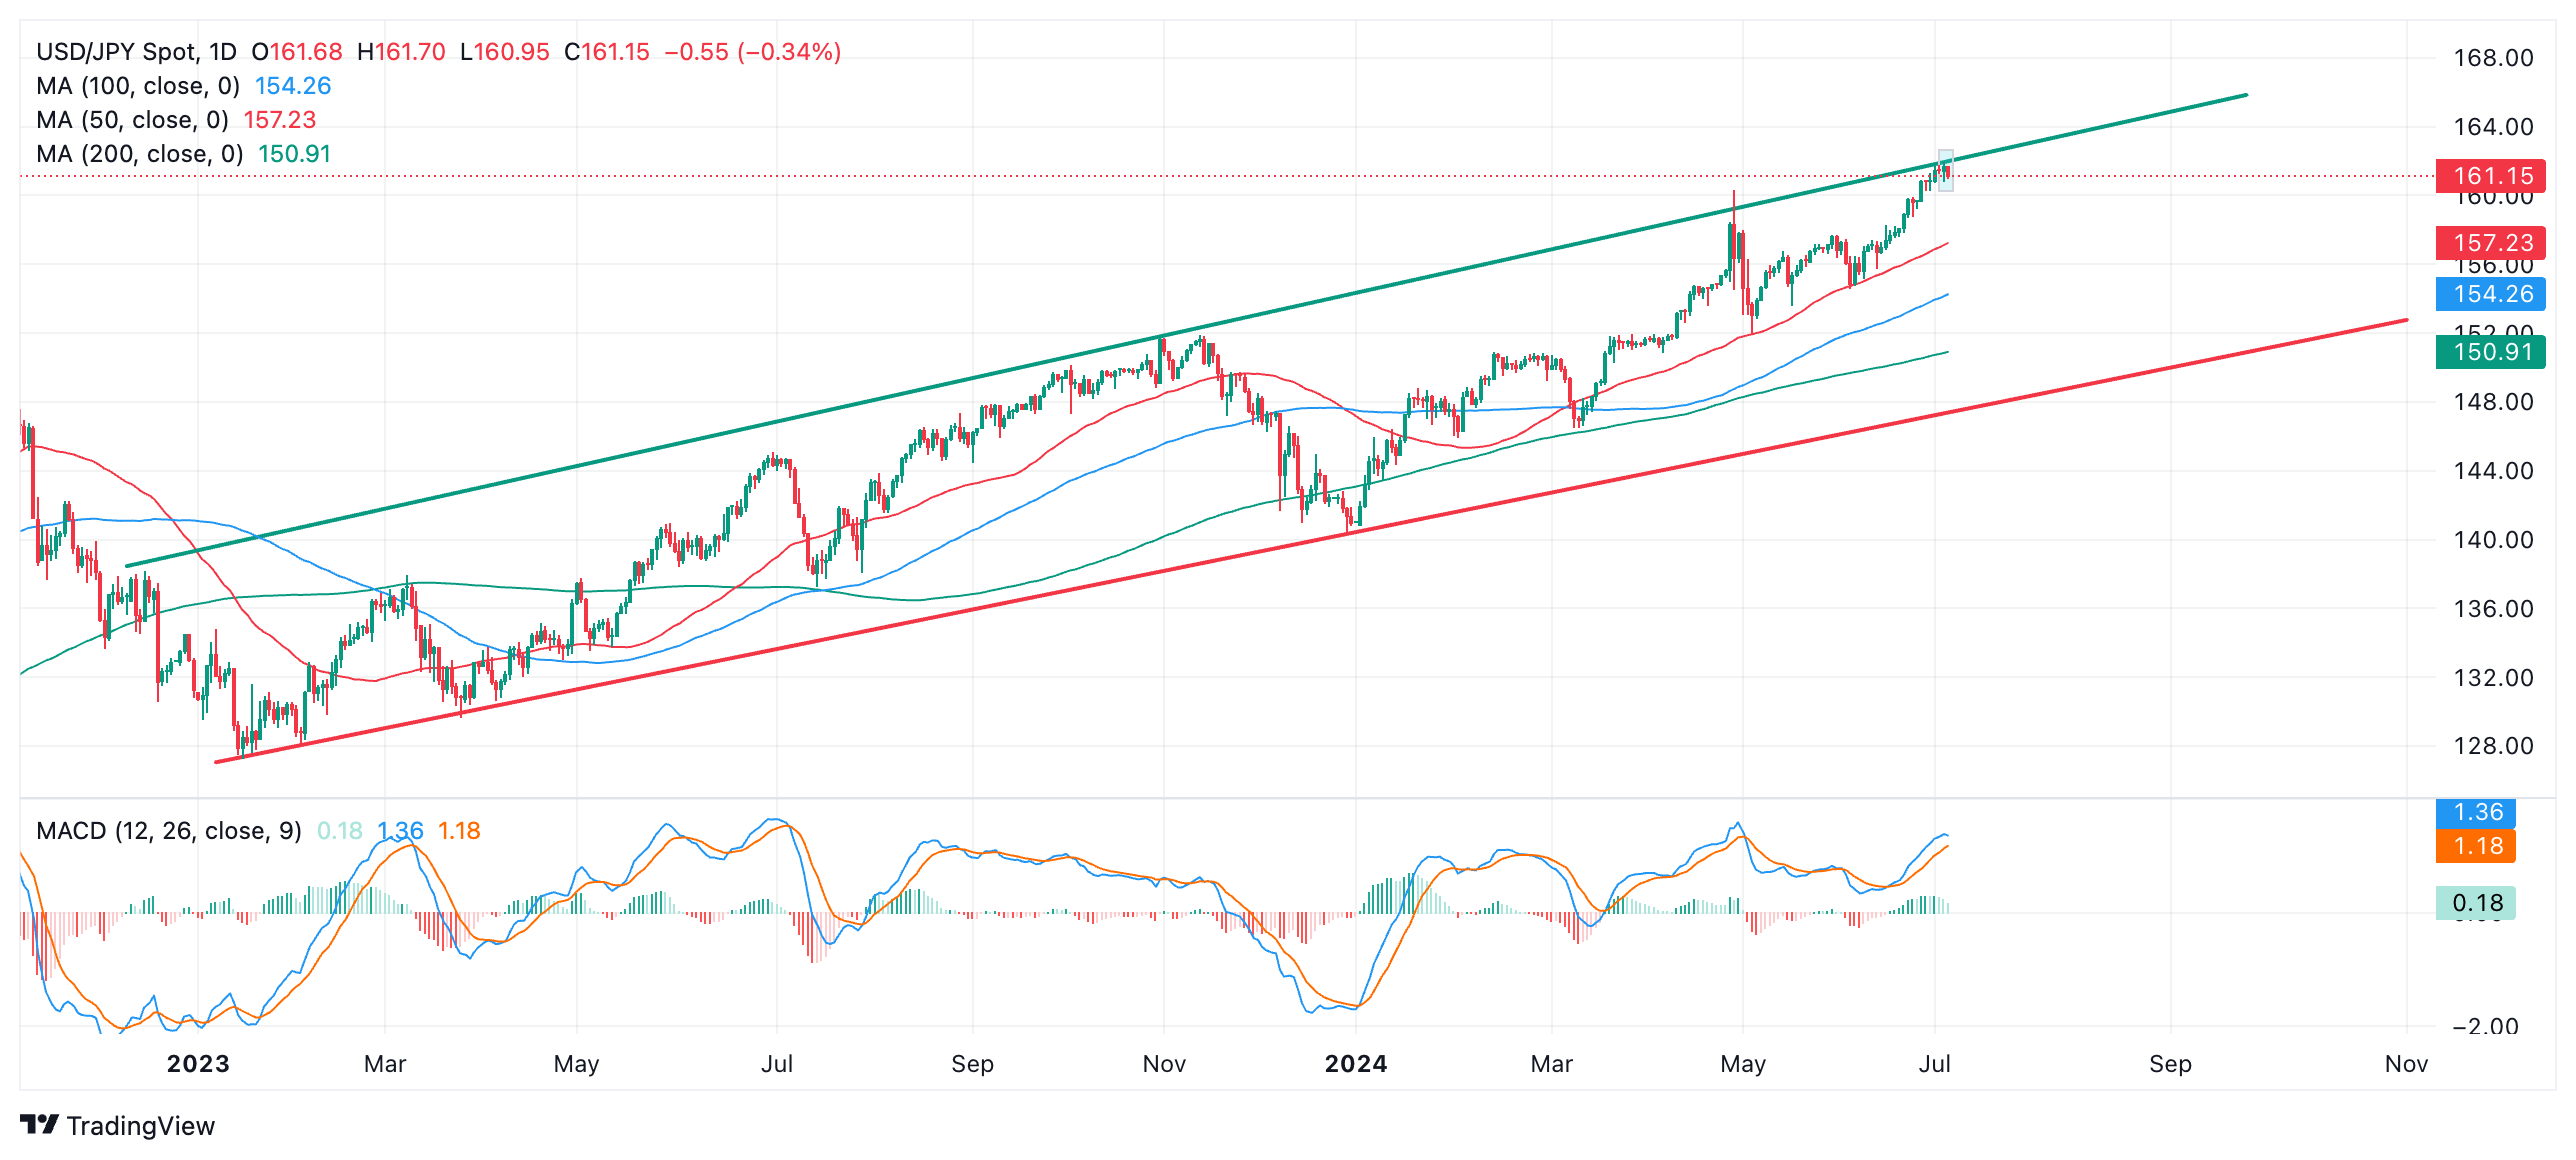
The top of the channel will present resistance to bulls acting as a barrier to them pushing price higher. 

USD/JPY posted a bearish Hanging Man Japanese candlestick pattern on Wednesday July 3 (blue-shaded rectangle) and this is further evidence a reversal may be developing. A Hanging Man develops when a candle forms at a peak with a small body near its high and a long wick below. 

USD/JPY Daily Chart 

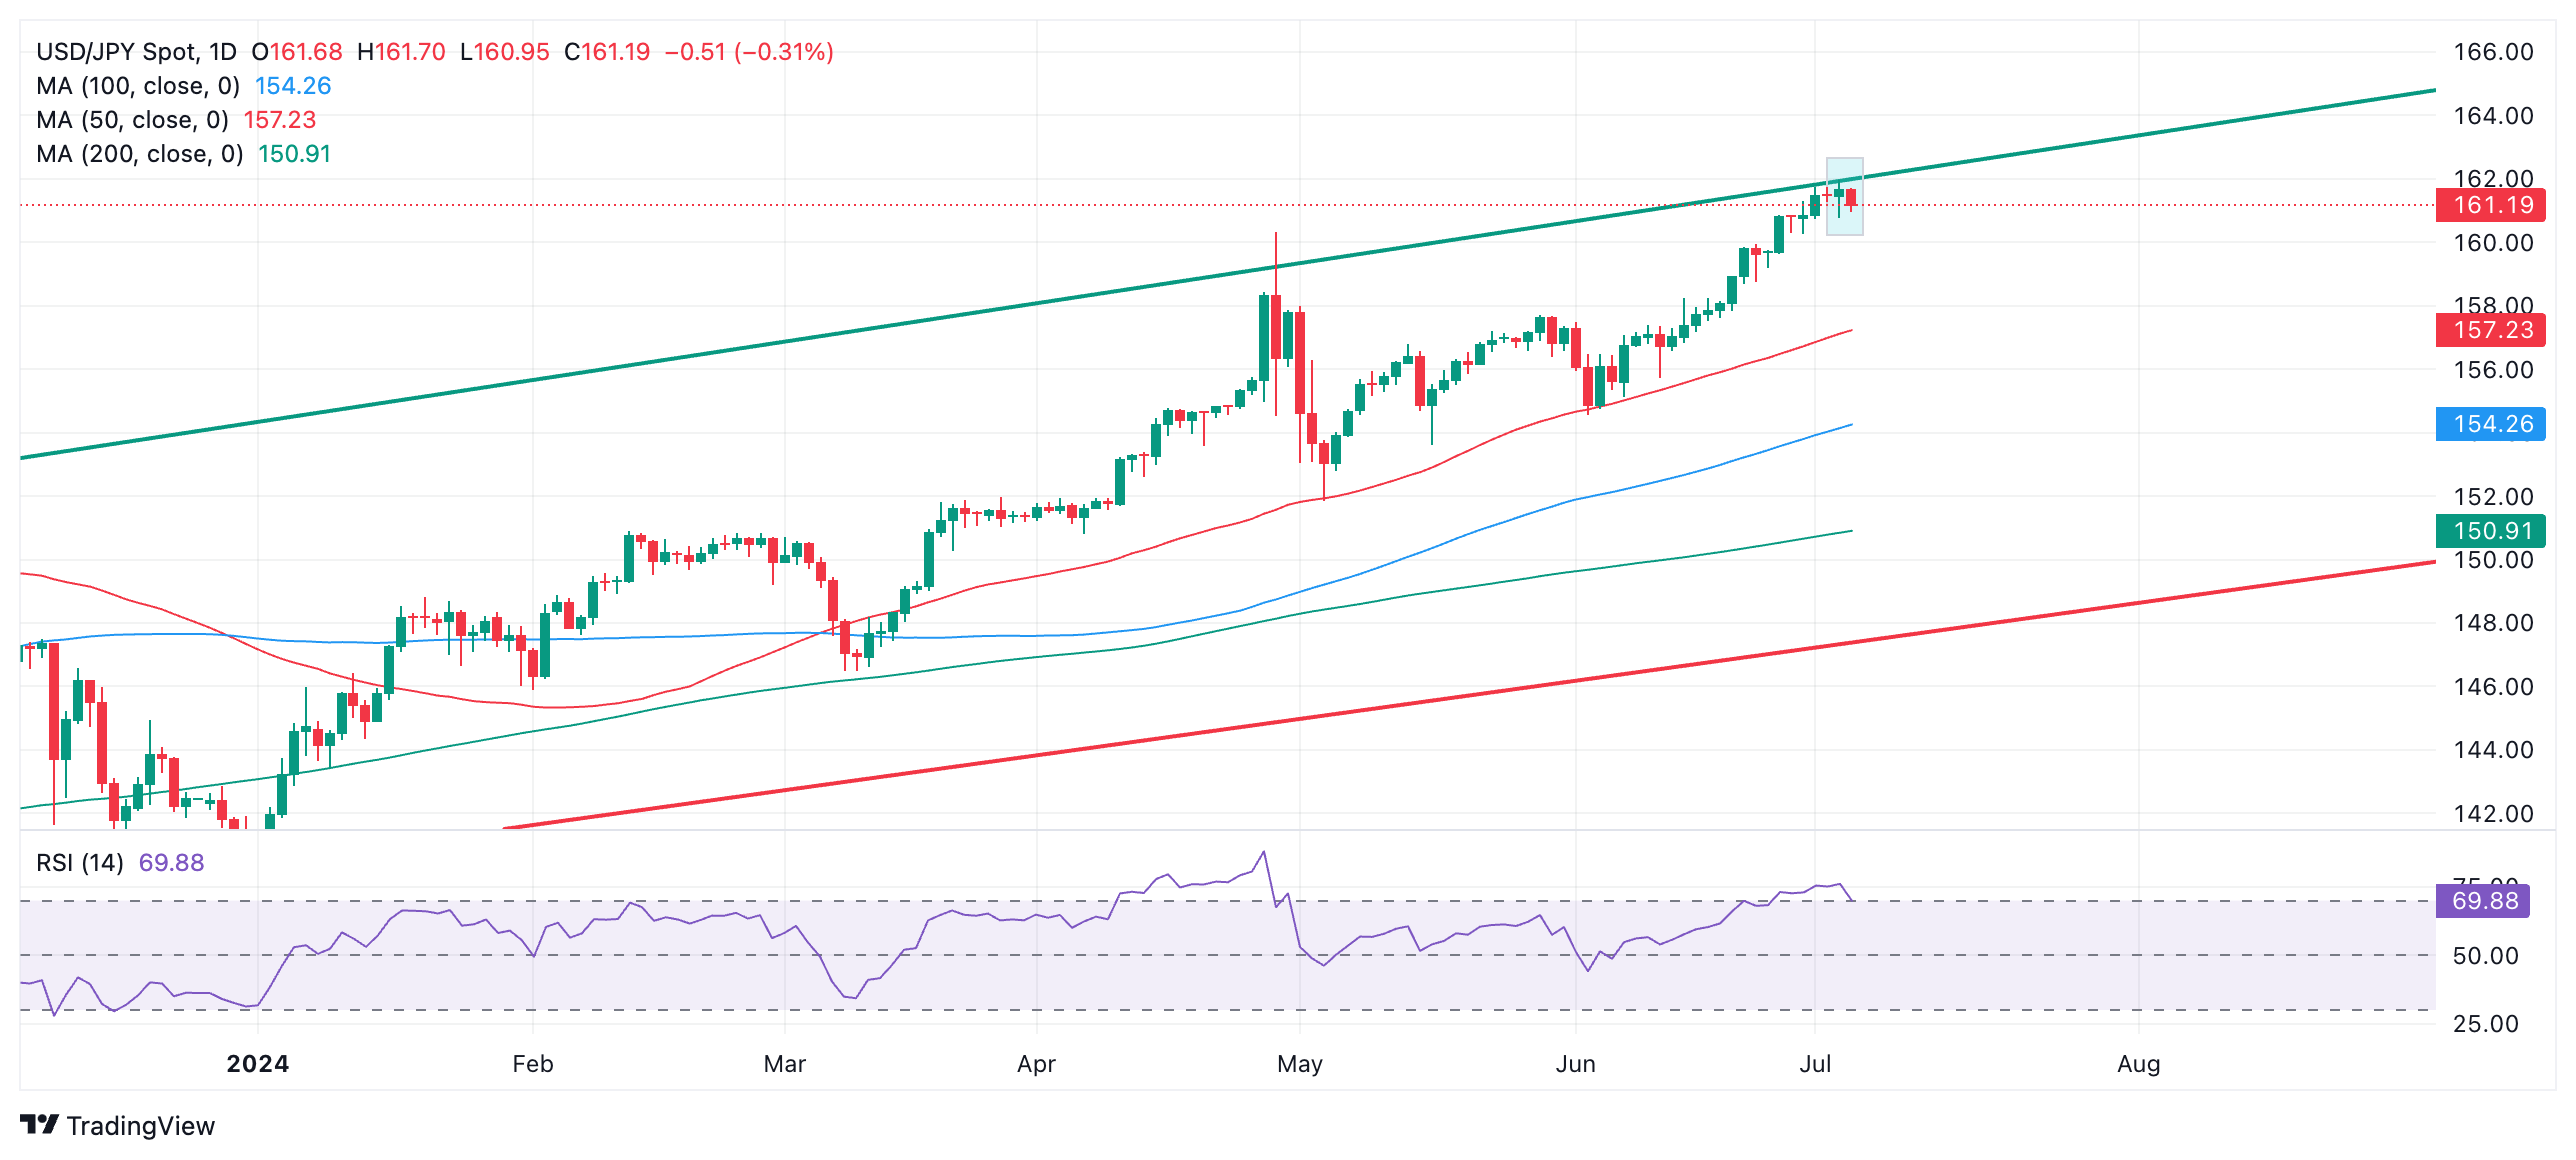
If Thursday ends as a red bearish candlestick it will provide confirmation of a short-term reversal.

The Relative Strength Index (RSI) momentum indicator is currently at 69.88. It is exiting the overbought zone. If it closes below 70 – as looks likely – it will provide a sell signal and further evidence of a short-term reversal. 

The resulting pull-back will probably fall down to support at around the 50-day Simple Moving Average (SMA) at 157.23. This has provided support on several occasions during USD/JPY’s uptrend. A break below 160.26 would add confirmation price could hit the bearish target. 

On the other hand, a decisive break out of the top of the channel would invalidate the bearish hypothesis and indicate a move higher, perhaps to 164.00 initially. Upside momentum beyond that, however, is unlikely to sustain for long. 

A decisive break would be one accompanied by a long green candle that broke clearly through the channel line and closed near its high, or three green candles in a row that broke above the channel line. 

Author

Joaquin Monfort

Joaquin Monfort is a financial writer and analyst with over 10 years experience writing about financial markets and alt data. He holds a degree in Anthropology from London University and a Diploma in Technical analysis.

More from Joaquin Monfort
Share:

Markets move fast. We move first.

Orange Juice Newsletter brings you expert driven insights - not headlines. Every day on your inbox.

By subscribing you agree to our Terms and conditions.

Editor's Picks

EUR/USD trades around 1.1700 after rebounding from 50-day EMA

EUR/USD gains ground after three days of losses, trading around 1.1700 during the Asian hours on Wednesday. On the daily chart, technical analysis indicates a potential for a bearish bias; the 14-day Relative Strength Index at 47 confirms waning momentum.

GBP/USD climbs above 1.3500 as US Dollar weakens ahead of ISM Services PMI

GBP/USD gains some ground after registering modest gains in the previous session, trading around 1.3510 during the Asian hours on Wednesday. The pair edges higher as the US Dollar struggles ahead of the US ISM Services Purchasing Managers’ Index and JOLTs job openings due later in the day.

Gold pulls back from $4,500 amid profit-taking ahead of key US macro data

Gold struggles to capitalize on its strong weekly gains registered over the past two days and faces rejection near the $4,500 psychological mark, or over a one-week high touched during the Asian session on Wednesday. As investors digest the recent US attack on Venezuela, the prevalent risk-on environment prompts some profit-taking around the commodity. 

Bitcoin, Ethereum and Ripple cool off as rally stalls near key resistance zones

Bitcoin, Ethereum, and Ripple prices are taking a breather on Wednesday near their key resistance levels following the recent surge. BTC faces rejection at the $94,253 level, while ETH and XRP follow BTC’s footsteps, struggling near $3,308 and $2.35, respectively.

Implications of US intervention in Venezuela

Events in Venezuela are top of mind for market participants, and while developments are associated with an elevated degree of uncertainty, we are not making any changes to our markets or economic forecasts as a result of the deposition of Nicolás Maduro. 

Aave Price Forecast: AAVE eyes bullish breakout as on-chain and derivatives data turns supportive

Aave (AAVE) price hovers around $172 on Wednesday, nearing the upper trendline of the falling parallel channel pattern. A break above this technical pattern favors the bulls.