|

USD/JPY Price Analysis: Pierces 61.8% Fibonacci following Monday’s Doji

  • USD/JPY holds onto recovery gains
  • The previous day’s trend reversal signaling candlestick formation, sustained break of 61.8% Fibonacci retracement favor buyers.
  • 21-day SMA offers immediate support.

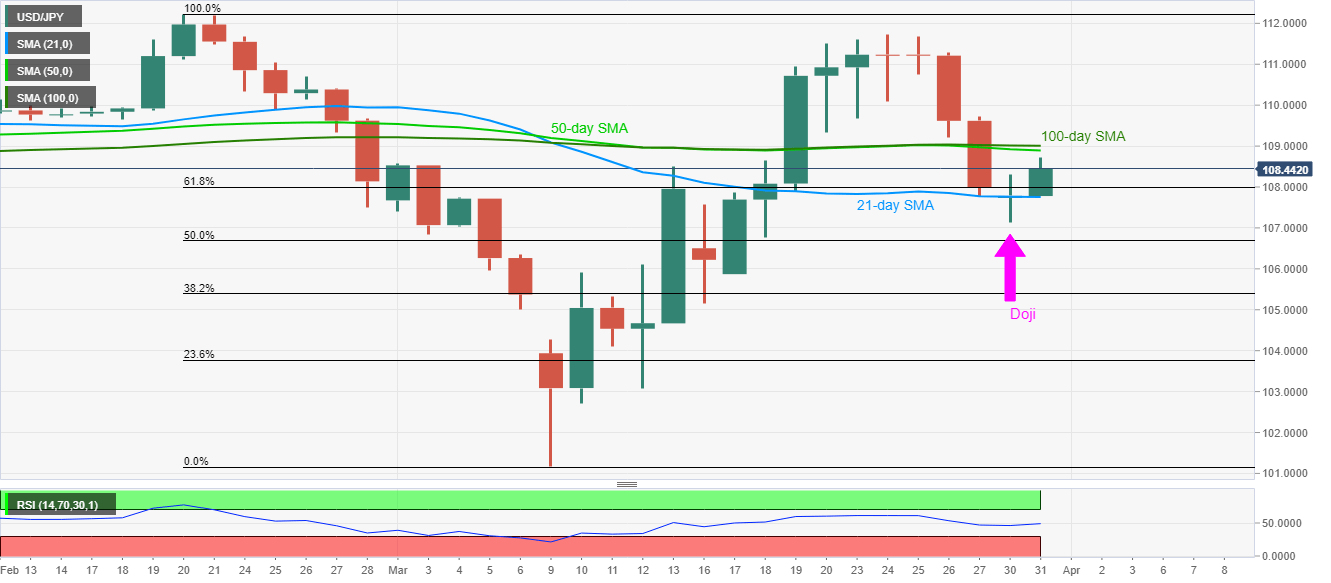
USD/JPY takes clues from Monday’s Doji formation while rising 0.63% to 108.45 during the early Tuesday. In doing so, the pair clears 61.8% Fibonacci retracement of its fall from February 20.

Even so, a confluence of 100-day and 50-day SMAs near 108.90-109.00 could question the pair’s immediate upside, a break of which could escalate the recovery moves towards 109.70/80.

It should, however, be noted that the pair’s sustained rise past-109.80 needs a sustained break beyond the monthly top near 111.70/75 to aim for February month high around 112.25.

Meanwhile, a 21-day SMA level of 107.75 offers the immediate support while a daily closing below Monday’s low near 107.10 will defy the candlestick formation and drag the USD/JPY prices towards March 12 high near 106.10.

USD/JPY daily chart

Trend: Further recovery expected

Additional important levels

Overview
Today last price108.54
Today Daily Change0.76
Today Daily Change %0.71%
Today daily open107.78
 
Trends
Daily SMA20107.69
Daily SMA50108.91
Daily SMA100109.01
Daily SMA200108.33
 
Levels
Previous Daily High108.3
Previous Daily Low107.12
Previous Weekly High111.72
Previous Weekly Low107.76
Previous Monthly High112.23
Previous Monthly Low107.51
Daily Fibonacci 38.2%107.85
Daily Fibonacci 61.8%107.57
Daily Pivot Point S1107.17
Daily Pivot Point S2106.56
Daily Pivot Point S3106
Daily Pivot Point R1108.35
Daily Pivot Point R2108.91
Daily Pivot Point R3109.52

Author

Anil Panchal

Anil Panchal

FXStreet

Anil Panchal has nearly 15 years of experience in tracking financial markets. With a keen interest in macroeconomics, Anil aptly tracks global news/updates and stays well-informed about the global financial moves and their implications.

More from Anil Panchal
Share:

Editor's Picks

EUR/USD looks weak below 1.1800

EUR/USD has slipped back under pressure, breaking through the 1.1800 support and drifting towards the weekly lows near 1.1770 ahead of the opening bell in Asia. The move reflects renewed strength in the US Dollar, with steady geopolitical tensions keeping its demand firm. Moving forward, the release of the German labour market report and flash inflation figures should keep European investors entertained on Friday.
 

GBP/USD threatens the 200-day SMA near 1.3440

GBP/USD rapidly leaves behind Wednesday’s strong advance, coming under heavy pressure and retesting the 1.3440 zone, where the critical 200-day SMA is located. Cable’s deep pullback follows the strong gains in the Greenback, while investors continue to pencil in a potential BoE rate cut in March.

Gold trims gains, slips back to around $5,170

Gold is now facing some downside pressure, hovering around the $5,170 region on Thursday. The yellow metal surrenders part of its earlier gains on the back of the resurgence of the buying interest in the Greenback. In the meantime, geopolitical tensions in the Middle East continue to limit the downside potential for now.

How AI, blockchain, stablecoins are shaping a new global economy – Circle CEO Jeremy Allaire

Artificial Intelligence (AI), blockchain technology and stablecoins are emerging as core pillars of a new global economic system, according to Circle’s CEO, Jeremy Allaire.

Changing the game: International implications of recent tariff developments

The Supreme Court ruling on International Emergency Economic Powers Act (IEEPA) tariffs provides limited relief for the rest of the world, with weighted average tariff rates modestly lower.

Bitcoin steadies as traders eye US–Iran talks

Bitcoin (BTC) price is stabilizing around $68,000 at the time of writing on Thursday after a 6.2% relief rally the previous day amid a broader downward trend.