- USD/JPY experienced minor losses due to threats of Japanese Forex intervention and US Independence Day trading lull.
- Technical indicators suggest the potential for a pullback, with the RSI nearing the overbought threshold and a negative RoC.
- If USD/JPY retraces, key supports stand at 144.00 and 143.11, while a rally could target the November highs and beyond.
USD/JPY trades with minuscule losses amidst verbal intervention by Japanese authorities, as week as choppy trading, with traders in the United States (US) out for the US Independence Day holiday. The USD/JPY is exchanging hands at 144.48 after hitting a daily high of 144.70.
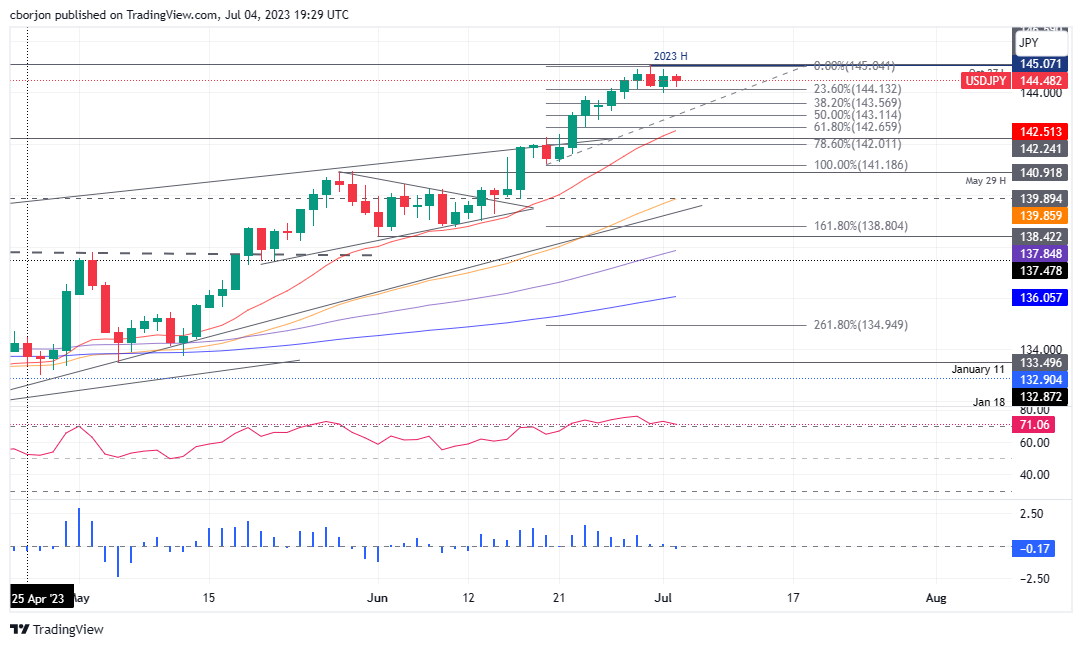
USD/JPY Price Analysis: Technical outlook
The USD/JPY remains upward biased even though it cannot edge towards a new year-to-date (YTD) high of 145.07 amidst threats from Japanese authorities of steepening into the Forex markets. It should be said the Relative Strength Index (RSI) remains at overbought conditions, about to cross below the 70 levels, which could open the door for a deeper pullback.
Furthermore, the three-day Rate of Change (RoC) portrays that selling pressure is fading as it turned negative, suggesting that further downside is possible.
If USD/JPY retraces, the first support will be the 144.00 figure. A breach of the latter will expose the 38.2% Fibonacci retracement at 146.57, drawn from the lows of June 28 toward the YTD high. Once cleared, the 50% Fibo retracement will be up next at 143.11, followed by the confluence of the 20-day Exponential Moving Average (EMA) and the 61.8% golden ratio at 142.51/65.
Conversely, if USD/JPY rallies to new YTD highs above 145.00, the next resistance would be the November 10 high at 146.59, followed by the November 1 daily high at 148.82 and 2022 high at 151.94.
USD/JPY Price Action – Daily chart
Information on these pages contains forward-looking statements that involve risks and uncertainties. Markets and instruments profiled on this page are for informational purposes only and should not in any way come across as a recommendation to buy or sell in these assets. You should do your own thorough research before making any investment decisions. FXStreet does not in any way guarantee that this information is free from mistakes, errors, or material misstatements. It also does not guarantee that this information is of a timely nature. Investing in Open Markets involves a great deal of risk, including the loss of all or a portion of your investment, as well as emotional distress. All risks, losses and costs associated with investing, including total loss of principal, are your responsibility. The views and opinions expressed in this article are those of the authors and do not necessarily reflect the official policy or position of FXStreet nor its advertisers. The author will not be held responsible for information that is found at the end of links posted on this page.
If not otherwise explicitly mentioned in the body of the article, at the time of writing, the author has no position in any stock mentioned in this article and no business relationship with any company mentioned. The author has not received compensation for writing this article, other than from FXStreet.
FXStreet and the author do not provide personalized recommendations. The author makes no representations as to the accuracy, completeness, or suitability of this information. FXStreet and the author will not be liable for any errors, omissions or any losses, injuries or damages arising from this information and its display or use. Errors and omissions excepted.
The author and FXStreet are not registered investment advisors and nothing in this article is intended to be investment advice.
Recommended content
Editors’ Picks
EUR/USD eases to daily lows near 1.0260
Better-than-expected results from the US docket on Friday lend wings to the US Dollar and spark a corrective decline in EUR/USD to the area of daily lows near 1.0260.
GBP/USD remains under pressure on strong Dollar, data
GBP/USD remains on track to close another week of losses on Friday, hovering around the 1.2190 zone against the backdrop of the bullish bias in the Greenback and poor results from the UK calendar.
Gold recedes from tops, retests $2,700
The daily improvement in the Greenback motivates Gold prices to give away part of the weekly strong advance and slip back to the vicinity of the $2,700 region per troy ounce at the end of the week.
Five keys to trading Trump 2.0 with Gold, Stocks and the US Dollar Premium
Donald Trump returns to the White House, which impacts the trading environment. An immediate impact on market reaction functions, tariff talk and regulation will be seen. Tax cuts and the fate of the Federal Reserve will be in the background.
Hedara bulls aim for all-time highs
Hedara’s price extends its gains, trading at $0.384 on Friday after rallying more than 38% this week. Hedara announces partnership with Vaultik and World Gemological Institute to tokenize $3 billion in diamonds and gemstones
Trusted Broker Reviews for Smarter Trading
VERIFIED Discover in-depth reviews of reliable brokers. Compare features like spreads, leverage, and platforms. Find the perfect fit for your trading style, from CFDs to Forex pairs like EUR/USD and Gold.