|

USD/JPY Price Analysis: Long-term trend at risk of reversing

  • USD/JPY has fallen to key make-or-break support for the pair. 
  • A break below could indicate a change of the long-term trend and more downside. 

USD/JPY has weakened over the last three weeks and reached support at a key price level on the charts, roughly in the 151.80s – which coincides with the October 2022 and 2023 highs. 

USD/JPY Weekly Chart 


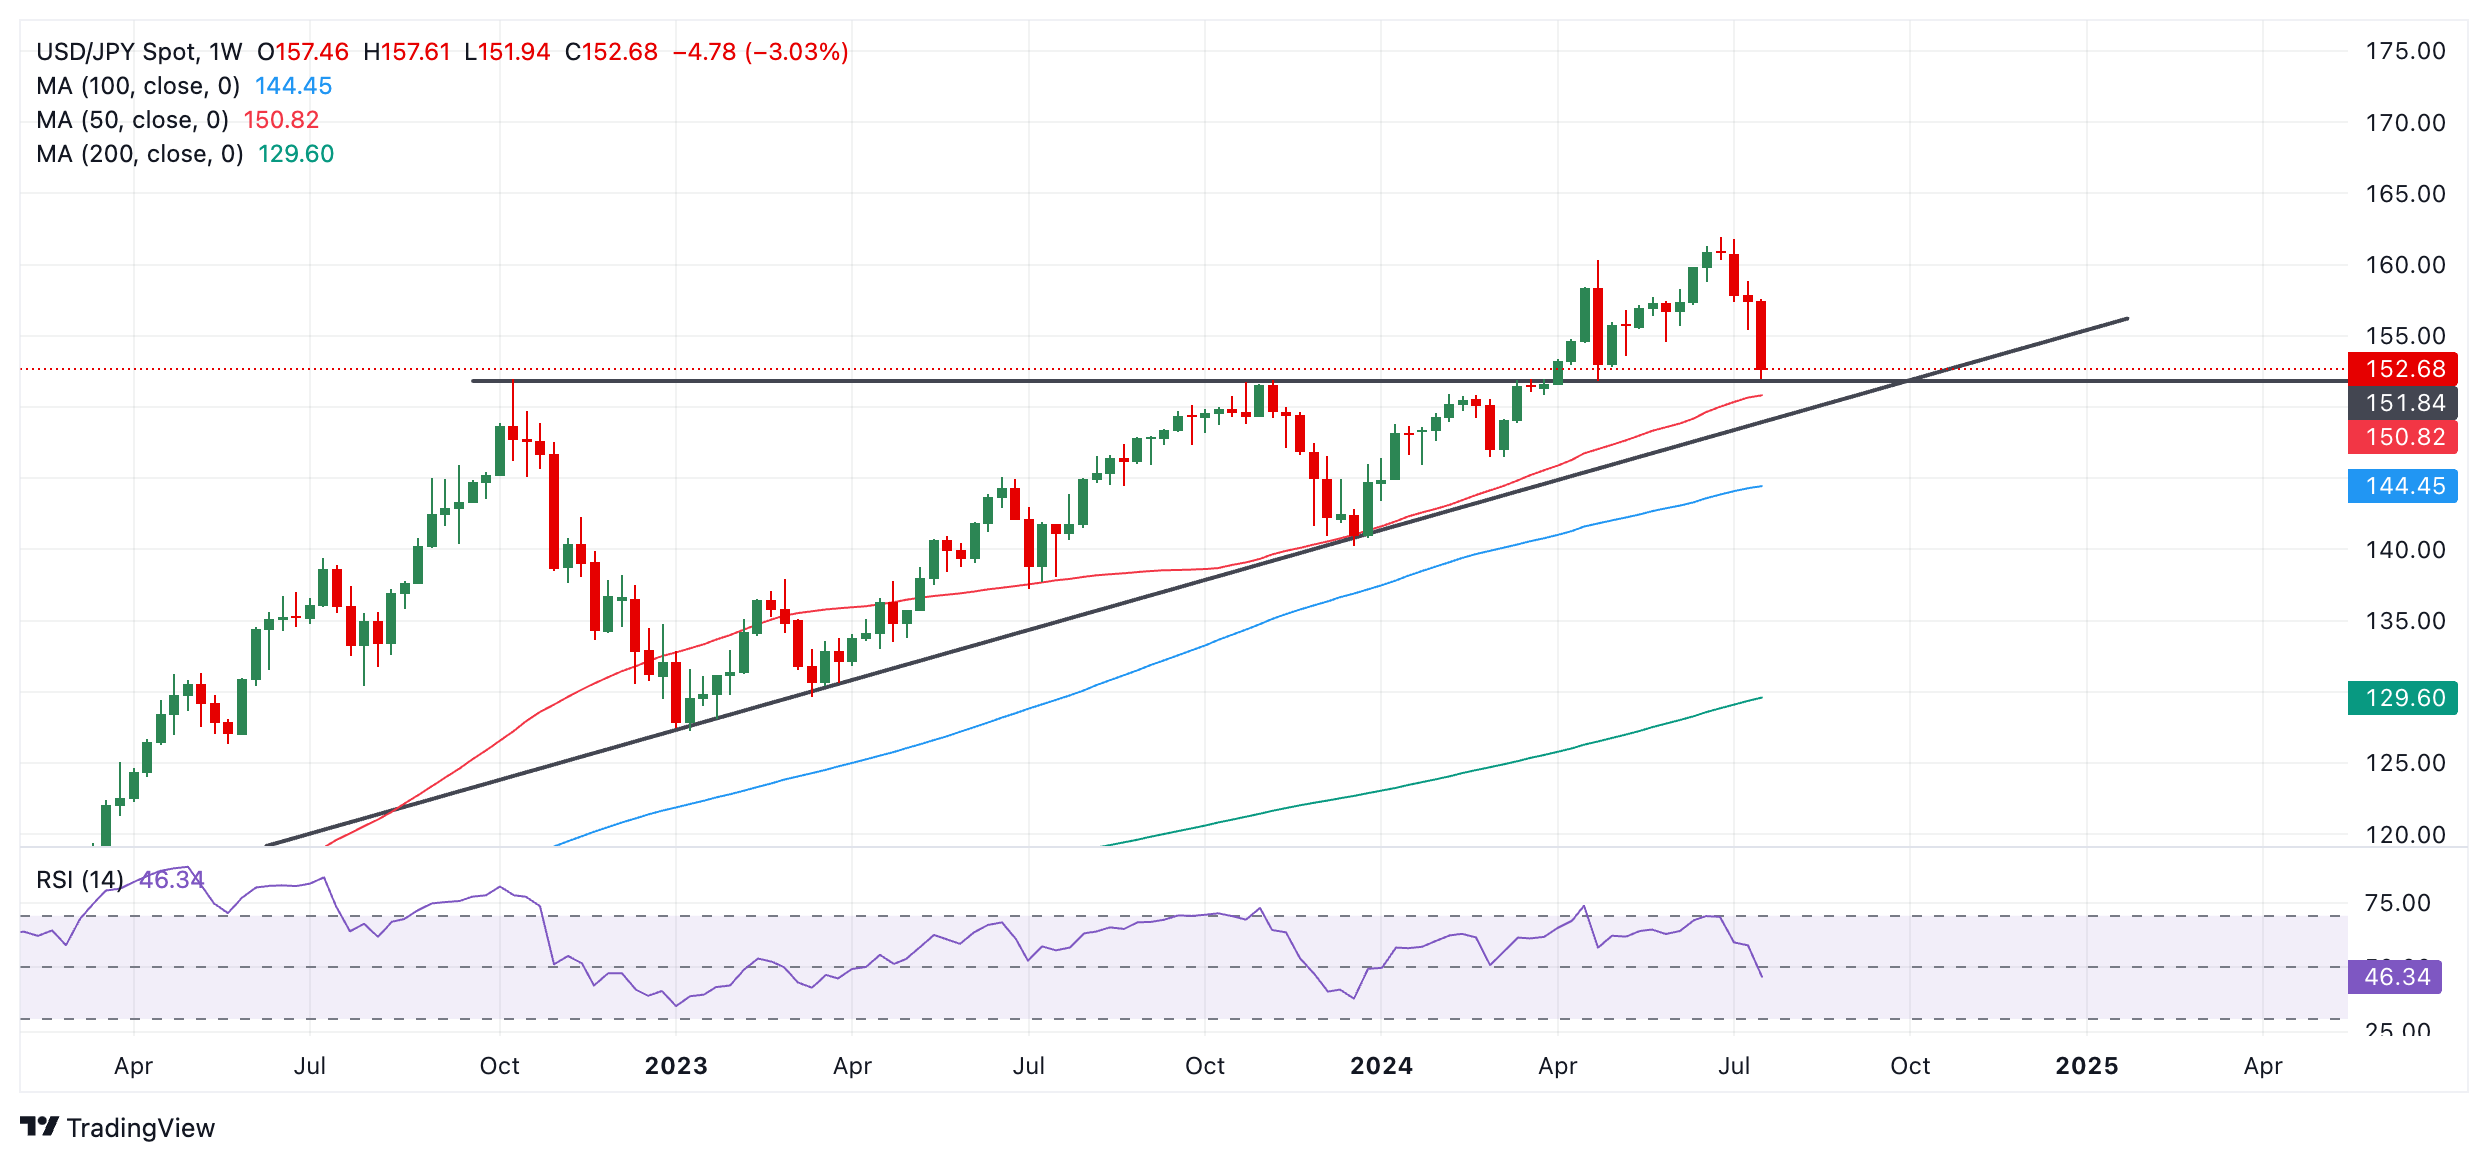
The long-term trend remains bullish suggesting the odds on balance favor a recovery, however, there are no signs yet from price action that this is the case. USD/JPY keeps going lower. In addition, if this week ends as a long red candlestick (we are already halfway through Thursday) the weekly chart will have formed an ominous Three Black Crows Japanese candlestick pattern, with bearish implications. 

The current support level is very significant and represents a crossroads for price. A recovery bounce from here might indicate the longer-term uptrend was resuming. On the other hand a break below would bring the long-term uptrending bias into doubt. 

Further, a break below the 50-week Simple Moving Average and a decisive break below the major trendline for the uptrend situated at roughly 149.50, would confirm a reversal in the long-term trend. Such a break would open up downside targets at roughly 141.60, followed by 136.85. 

A decisive break would be one in which USD/JPY broke clearly below the trendline with a long red candlestick that closed near its low, or three red candlesticks in a row. 

Price would need to form a bullish reversal pattern at the current level for confidence the longer-term uptrend was resuming. This could be a Japanese Hammer or a Two-Bar reversal, for example. This would then indicate prices might recover and retouch the 161.95 high (June 28), and perhaps even make a new higher high.

Author

Joaquin Monfort

Joaquin Monfort is a financial writer and analyst with over 10 years experience writing about financial markets and alt data. He holds a degree in Anthropology from London University and a Diploma in Technical analysis.

More from Joaquin Monfort
Share:

Markets move fast. We move first.

Orange Juice Newsletter brings you expert driven insights - not headlines. Every day on your inbox.

By subscribing you agree to our Terms and conditions.

Editor's Picks

EUR/USD drops to daily lows near 1.1630

EUR/USD now loses some traction and slips back to the area of daily lows around 1.1630 on the back of a mild bounce in the US Dollar. Fresh US data, including the September PCE inflation numbers and the latest read on December consumer sentiment, didn’t really move the needle, so the pair is still on course to finish the week with a respectable gain.

GBP/USD trims gains, recedes toward 1.3320

GBP/USD is struggling to keep its daily advance, coming under fresh pressure and retreating to the 1.3320 zone following a mild bullish attempt in the Greenback. Even though US consumer sentiment surprised to the upside, the US Dollar isn’t getting much love, as traders are far more interested in what the Fed will say next week.

Gold makes a U-turn, back to $4,200

Gold is now losing the grip and receding to the key $4,200 region per troy ounce following some signs of life in the Greenback and a marked bounce in US Treasury yields across the board. The positive outlook for the precious metal, however, remains underpinned by steady bets for extra easing by the Fed.

Crypto Today: Bitcoin, Ethereum, XRP pare gains despite increasing hopes of upcoming Fed rate cut

Bitcoin is steadying above $91,000 at the time of writing on Friday. Ethereum remains above $3,100, reflecting positive sentiment ahead of the Federal Reserve's (Fed) monetary policy meeting on December 10.

Week ahead – Rate cut or market shock? The Fed decides

Fed rate cut widely expected; dot plot and overall meeting rhetoric also matter. Risk appetite is supported by Fed rate cut expectations; cryptos show signs of life. RBA, BoC and SNB also meet; chances of surprises are relatively low.

Ripple faces persistent bear risks, shrugging off ETF inflows

Ripple is extending its decline for the second consecutive day, trading at $2.06 at the time of writing on Friday. Sentiment surrounding the cross-border remittance token continues to lag despite steady inflows into XRP spot ETFs.