- USD/JPY comes under heavy selling pressure amid a sharp USD pullback from a multi-month top.
- The Fed-BoJ policy divergence supports prospects for the emergence of dip-buying at lower levels.
- The overnight failure to find acceptance above the 200-day SMA warrants some caution for bulls.
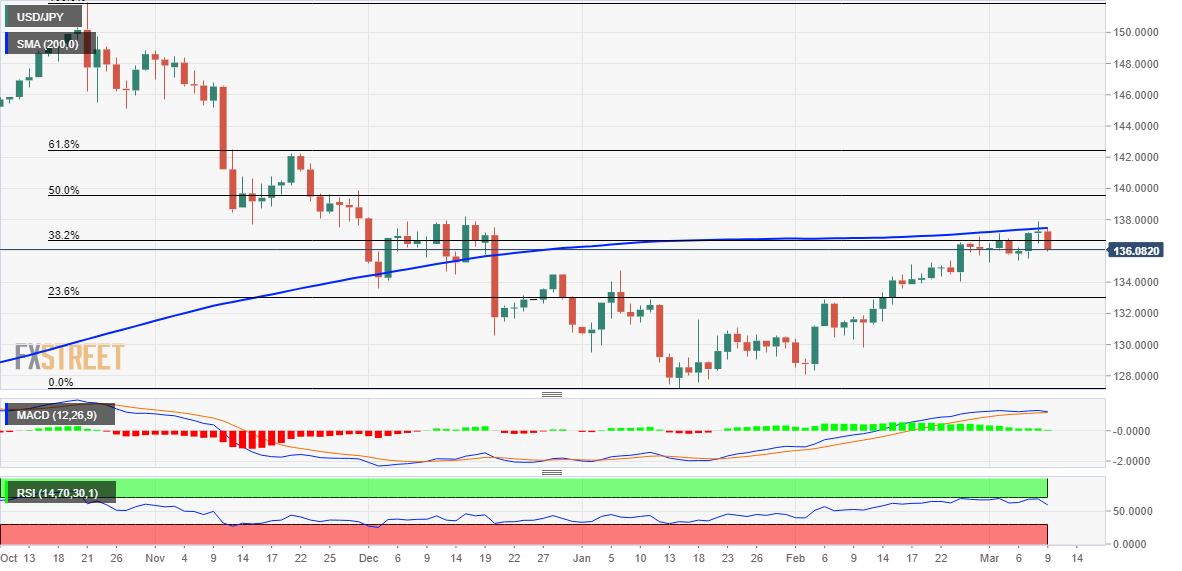
The USD/JPY pair meets with a fresh supply on Thursday and extends the previous day's modest pullback from the vicinity of the 138.00 mark, or its highest level since mid-December. The intraday selling picks up pace during the early North American session and momentarily drags spot prices below the 136.00 mark in the last hour.
The US Dollar (USD) bulls opt to take some profits off the table following the recent strong rally to over a three-month peak and turn out to be a key factor exerting pressure on the USD/JPY pair. Apart from this, the downfall could further be attributed to some repositioning trade ahead of the Bank of Japan (BoJ) monetary policy decision, scheduled to be announced during the Asian session on Friday.
The downside for the USD, however, is more likely to remain cushioned amid rising bets for a jumbo 50 bps lift-off at the March FOMC meeting. In contrast, the BoJ is expected to stick to its ultra-easy policy settings to support the fragile domestic economy. The divergent policy stance adopted by the two major central banks supports prospects for the emergence of some dip-buying around the USD/JPY pair.
From a technical perspective, the overnight failure to find acceptance above the very important 200-day Simple Moving Average (SMA) warrants caution for bullish traders. This makes it prudent to wait for a sustained move beyond the overnight swing high, around the 137.90 area, before positioning for any further gains. The USD/JPY pair might then climb to the 138.50 intermediate barrier en route to the 139.00 round figure.
On the flip side, any further decline is more likely to attract fresh buyers near the 135.35 horizontal support zone. That said, a convincing breakthrough, leading to a subsequent weakness below the 135.00 psychological mark, might shift the near-term bias in favour of bearish traders. Spot prices might then accelerate the fall towards the 134.75-134.70 area before eventually dropping to the 134.25 area and the 134.00 round figure.
USD/JPY daily chart
Key levels to watch
Information on these pages contains forward-looking statements that involve risks and uncertainties. Markets and instruments profiled on this page are for informational purposes only and should not in any way come across as a recommendation to buy or sell in these assets. You should do your own thorough research before making any investment decisions. FXStreet does not in any way guarantee that this information is free from mistakes, errors, or material misstatements. It also does not guarantee that this information is of a timely nature. Investing in Open Markets involves a great deal of risk, including the loss of all or a portion of your investment, as well as emotional distress. All risks, losses and costs associated with investing, including total loss of principal, are your responsibility. The views and opinions expressed in this article are those of the authors and do not necessarily reflect the official policy or position of FXStreet nor its advertisers. The author will not be held responsible for information that is found at the end of links posted on this page.
If not otherwise explicitly mentioned in the body of the article, at the time of writing, the author has no position in any stock mentioned in this article and no business relationship with any company mentioned. The author has not received compensation for writing this article, other than from FXStreet.
FXStreet and the author do not provide personalized recommendations. The author makes no representations as to the accuracy, completeness, or suitability of this information. FXStreet and the author will not be liable for any errors, omissions or any losses, injuries or damages arising from this information and its display or use. Errors and omissions excepted.
The author and FXStreet are not registered investment advisors and nothing in this article is intended to be investment advice.
Recommended content
Editors’ Picks
EUR/USD holds below 1.0750 ahead of key US data
EUR/USD trades in a tight range below 1.0750 in the European session on Friday. The US Dollar struggles to gather strength ahead of key PCE Price Index data, the Fed's preferred gauge of inflation, and helps the pair hold its ground.
USD/JPY stays firm above 156.00 after BoJ Governor Ueda's comments
USD/JPY stays firm above 156.00 after surging above this level on the Bank of Japan's decision to leave the policy settings unchanged. BoJ Governor said weak Yen was not impacting prices but added that they will watch FX developments closely.
Gold price oscillates in a range as the focus remains glued to the US PCE Price Index
Gold price struggles to attract any meaningful buyers amid the emergence of fresh USD buying. Bets that the Fed will keep rates higher for longer amid sticky inflation help revive the USD demand.
Bitcoin Weekly Forecast: BTC’s next breakout could propel it to $80,000 Premium
Bitcoin’s recent price consolidation could be nearing its end as technical indicators and on-chain metrics suggest a potential upward breakout. However, this move would not be straightforward and could punish impatient investors.
US core PCE inflation set to signal firm price pressures as markets delay Federal Reserve rate cut bets
The core PCE Price Index, which excludes volatile food and energy prices, is seen as the more influential measure of inflation in terms of Fed positioning. The index is forecast to rise 0.3% on a monthly basis in March, matching February’s increase.