USD/JPY Price Analysis: Correction from top of channel finds support
- USD/JPY has corrected back after touching the top of a rising channel.
- It has found support at a key support and resistance level and found its feet.
- The outlook remains bearish on balance in the short-term but the risk of a recovery has increased.

USD/JPY has corrected back after touching the top of a rising channel it has been in since the start of 2023.
USD/JPY Daily Chart
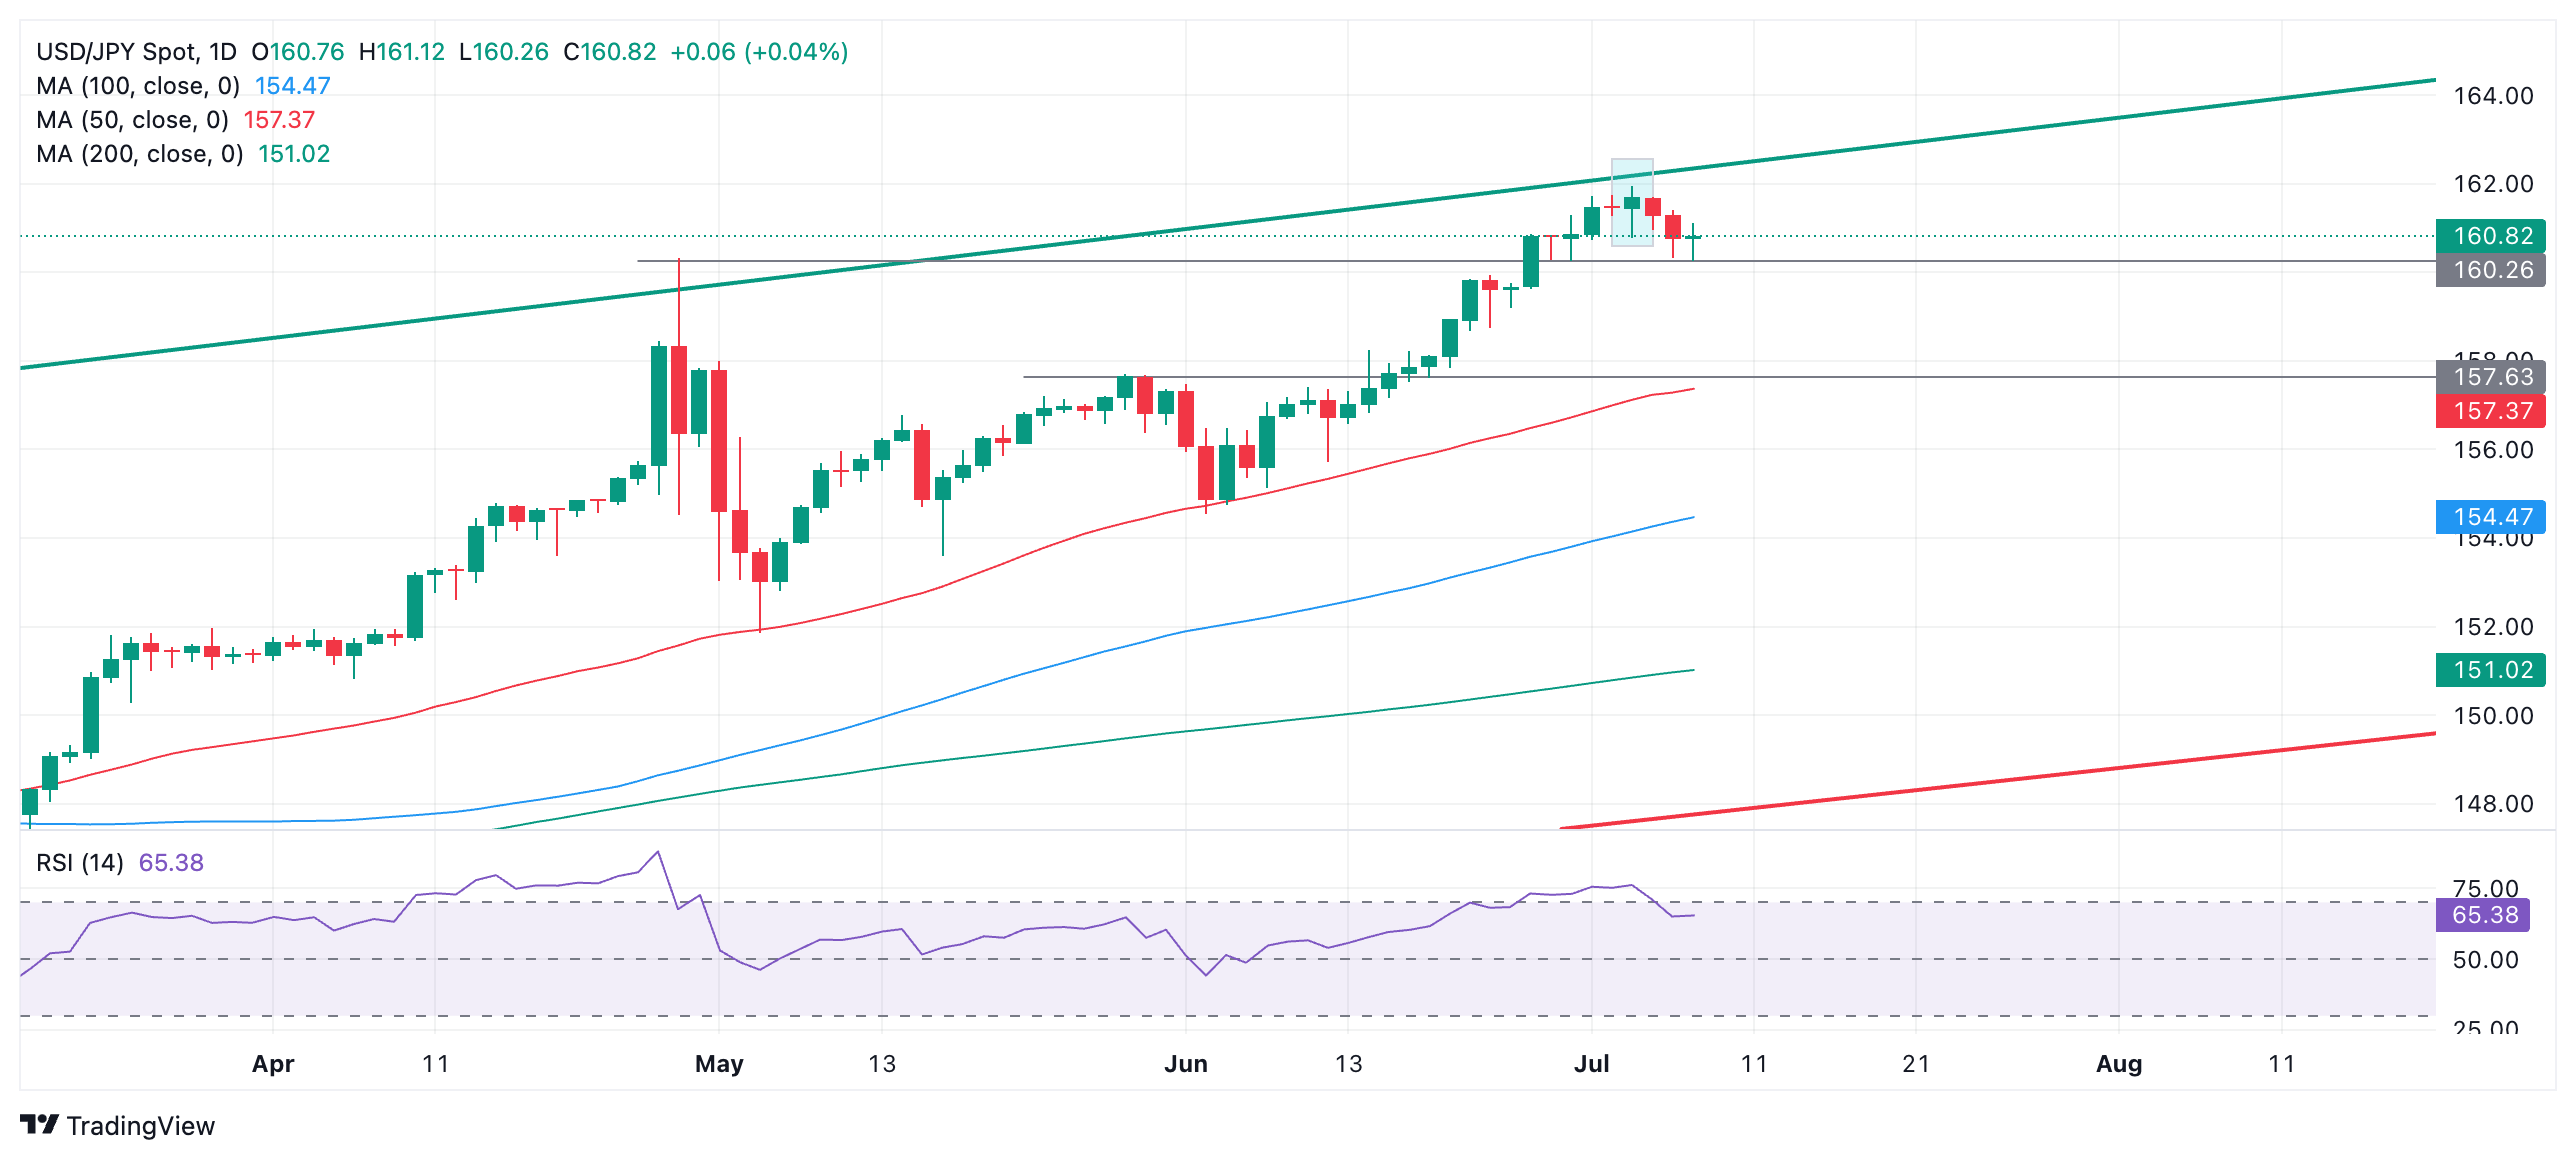
USD/JPY posted a bearish Hanging Man Japanese candlestick pattern on Wednesday July 3 (blue-shaded rectangle). The Hanging Man develops when a candle forms at a peak with a small body near its high and a long wick below. It was followed by a bearish down day, providing bearish confirmation.
USD/JPY proceeded to sell-off down to support from the April 29 high at 160.32, forming a price gap at the end of the move down – a possible sign of exhaustion.
USD/JPY 4-hour Chart
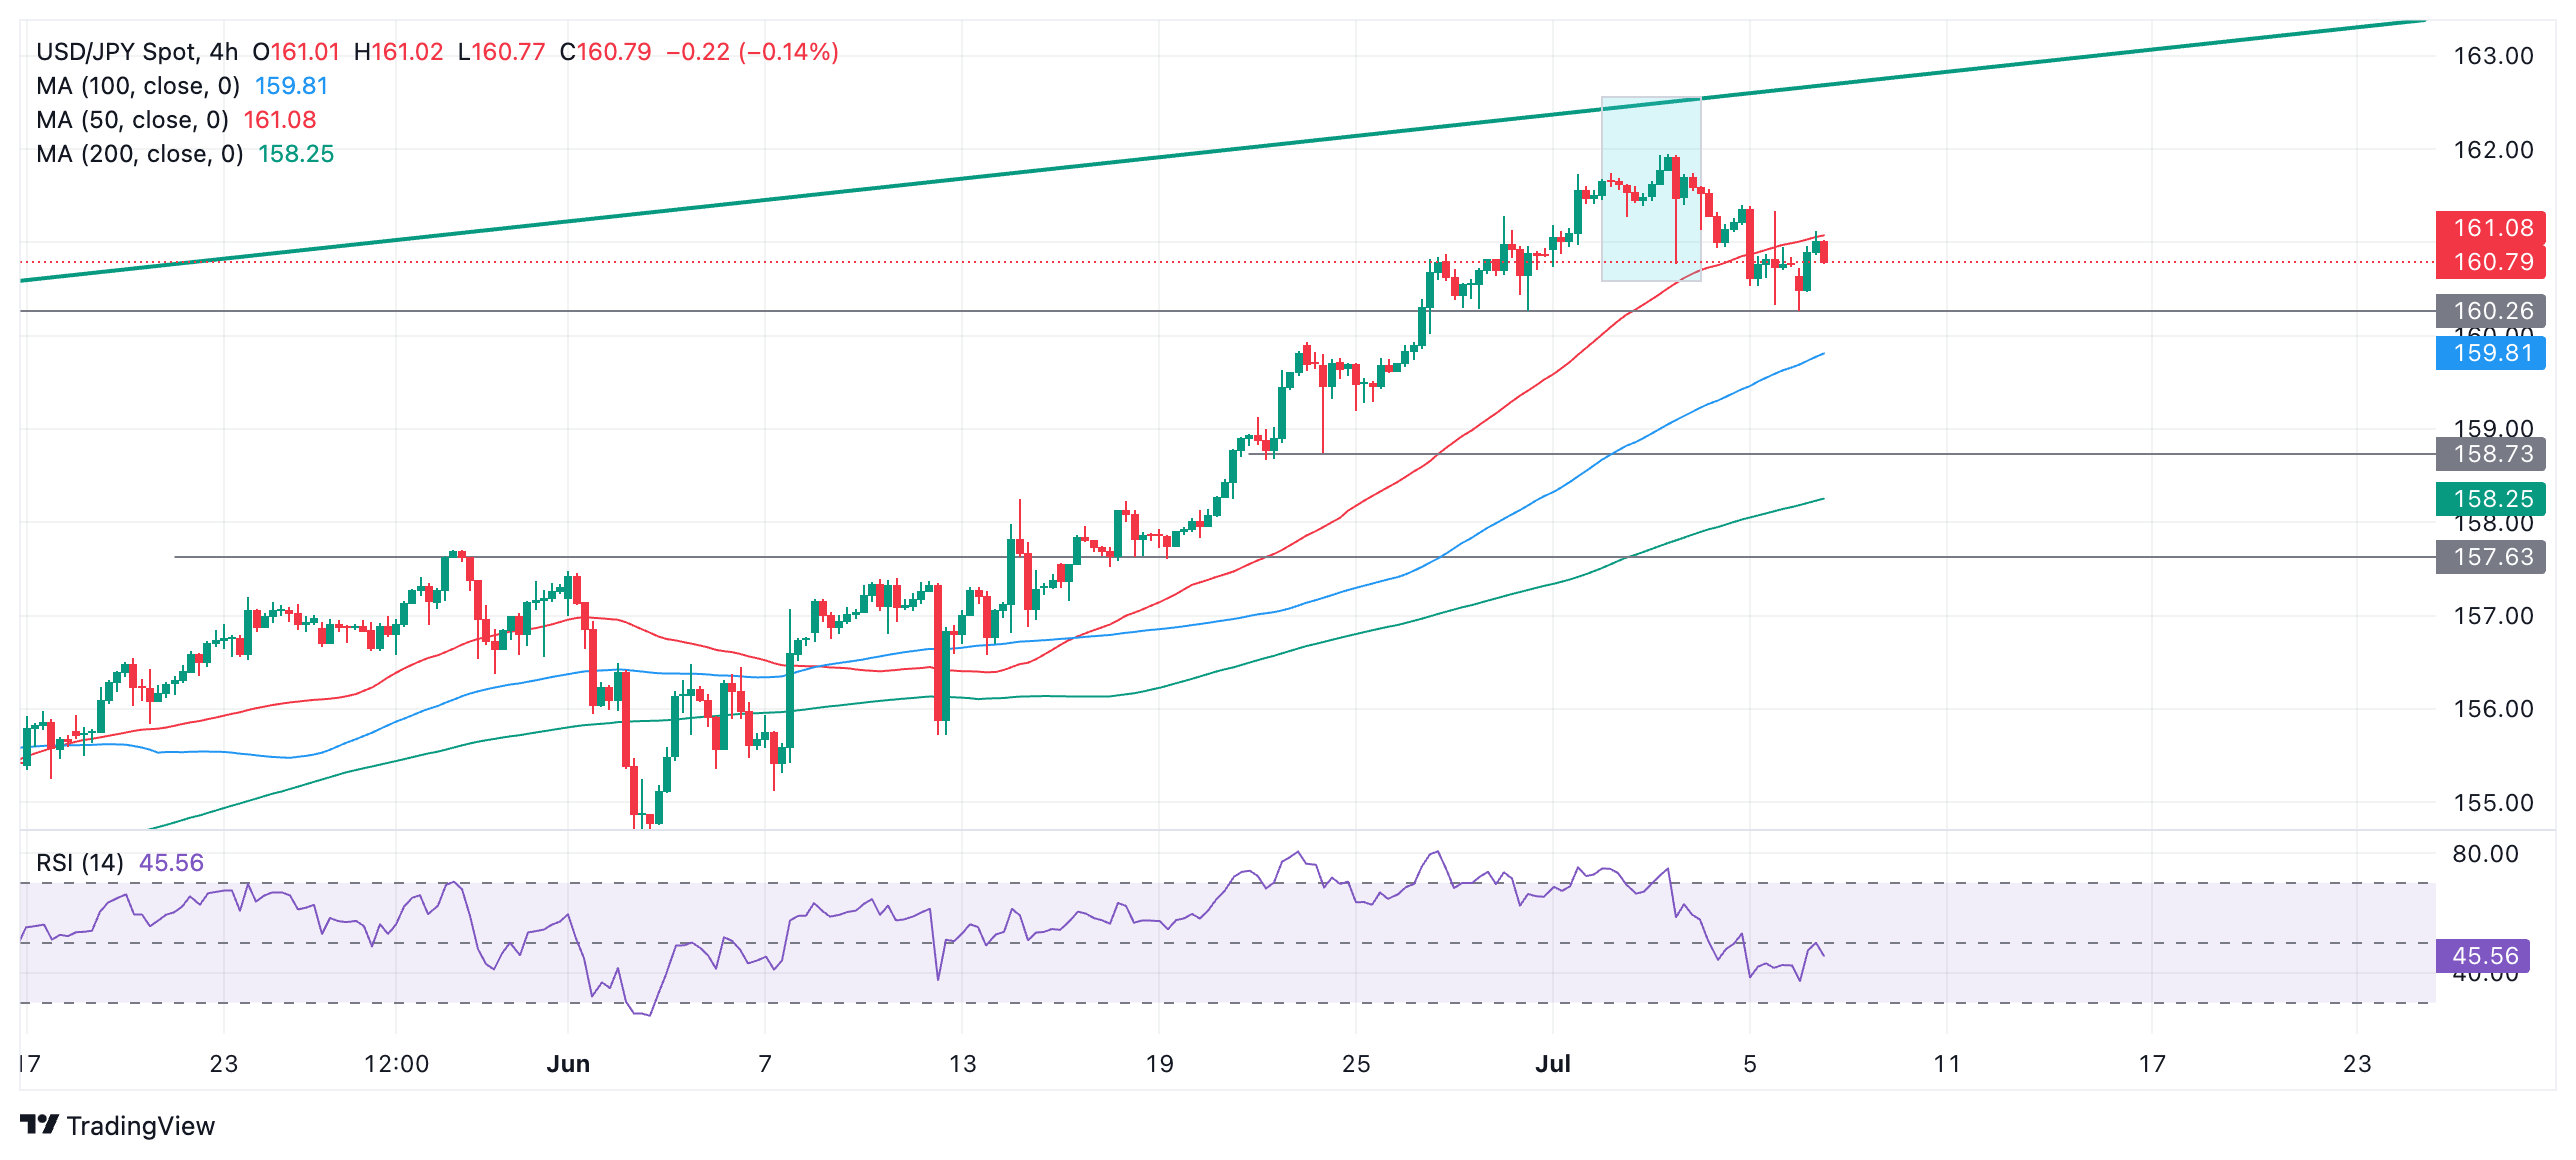
The pair has since recovered on July 8 (today) and filled the gap in the process. It is currently trading up against resistance from the 50-period Simple Moving Average (SMA).
Given the possible exhaustion gap that formed at the end of the sell-off, and the fact that it is in a strong medium and long-term uptrend, there is a risk the pair could continue recovering. Most corrections are composed of three waves and so far the rebound has only formed one complete wave. It is possible it could at the least recover even higher, to a target at 161.40, the July 5 high, as it completes.
As things stand the pair technically remains in short-term downtrend which given “the trend is your friend” could also potentially extend.
A break below 160.26, the July 8 lows, would provide confirmation of more downside to a probable target at 158.73, the June 24 low.
On the other hand, a break above 161.50 would be a bullish sign, and above 161.95 (July 3 high) would establish a higher high and indicate a resumption of the dominant uptrend. Such a move would probably reach the 162.70s initially, at the top of the rising channel, where it would again encounter resistance.
Author

Joaquin Monfort
FXStreet
Joaquin Monfort is a financial writer and analyst with over 10 years experience writing about financial markets and alt data. He holds a degree in Anthropology from London University and a Diploma in Technical analysis.


