- USD/JPY dribbles around multi-year high as overbought RSI tests buyers.
- Last weekly top, seven-week-old resistance line guard immediate upside.
- Convergence of 20-SMA, fortnight-old support line restricts short-term declines.
USD/JPY dribbles around the highest levels since 1998, taking rounds to 136.60 during Thursday’s Asian session.
Although overbought RSI and nearly hurdles challenge intraday buyers, the yen pair remains on the bull’s radar after rising for four consecutive days.
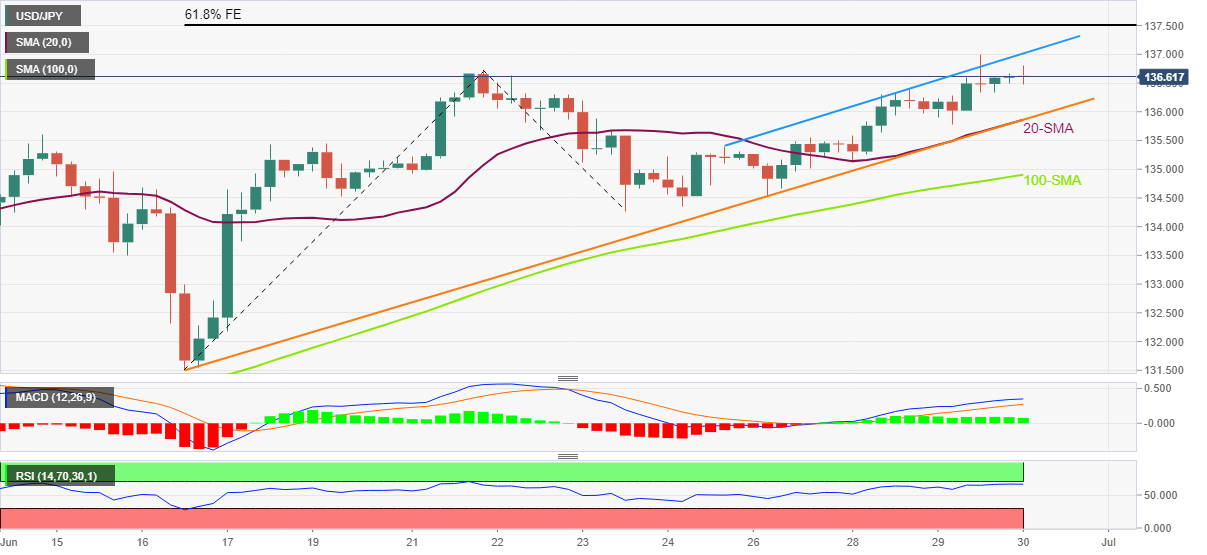
That said, the previous multi-year high around 136.70, marked during the last week, appears to restrict the USD/JPY pair’s immediate upside.
Following that, the one-week-old ascending resistance line can challenge the bulls at around 137.00.
In a case where the USD/JPY remains firmer past 137.00, the 61.8% Fibonacci Expansion (FE) of June 16-23 moves, near 137.50, will be in focus.
On the contrary, the 20-SMA and an upward sloping support line from June 16 restrict immediate downside around 135.85. Also challenging the bears are the upbeat MACD signal and bullish RSI divergence.
It’s worth noting that the downside break of 135.85 won’t hesitate to direct USD/JPY bears toward the 100-SMA support of 134.90 while the last Thursday’s low around 134.25 could challenge the sellers afterward.
Overall, USD/JPY remains on the bull’s radar despite recent inaction around the multi-year top.
USD/JPY: Four-hour chart
Trend: Further upside expected
Information on these pages contains forward-looking statements that involve risks and uncertainties. Markets and instruments profiled on this page are for informational purposes only and should not in any way come across as a recommendation to buy or sell in these assets. You should do your own thorough research before making any investment decisions. FXStreet does not in any way guarantee that this information is free from mistakes, errors, or material misstatements. It also does not guarantee that this information is of a timely nature. Investing in Open Markets involves a great deal of risk, including the loss of all or a portion of your investment, as well as emotional distress. All risks, losses and costs associated with investing, including total loss of principal, are your responsibility. The views and opinions expressed in this article are those of the authors and do not necessarily reflect the official policy or position of FXStreet nor its advertisers. The author will not be held responsible for information that is found at the end of links posted on this page.
If not otherwise explicitly mentioned in the body of the article, at the time of writing, the author has no position in any stock mentioned in this article and no business relationship with any company mentioned. The author has not received compensation for writing this article, other than from FXStreet.
FXStreet and the author do not provide personalized recommendations. The author makes no representations as to the accuracy, completeness, or suitability of this information. FXStreet and the author will not be liable for any errors, omissions or any losses, injuries or damages arising from this information and its display or use. Errors and omissions excepted.
The author and FXStreet are not registered investment advisors and nothing in this article is intended to be investment advice.
Recommended content
Editors’ Picks
EUR/USD alternates gains with losses near 1.0720 post-US PCE

The bullish tone in the Greenback motivates EUR/USD to maintain its daily range in the low 1.070s in the wake of firmer-than-estimated US inflation data measured by the PCE.
GBP/USD clings to gains just above 1.2500 on US PCE

GBP/USD keeps its uptrend unchanged and navigates the area beyond 1.2500 the figure amidst slight gains in the US Dollar following the release of US inflation tracked by the PCE.
Gold keeps its daily gains near $2,350 following US inflation

Gold prices maintain their constructive bias around $2,350 after US inflation data gauged by the PCE surpassed consensus in March and US yields trade with slight losses following recent peaks.
Bitcoin Weekly Forecast: BTC’s next breakout could propel it to $80,000 Premium

Bitcoin’s recent price consolidation could be nearing its end as technical indicators and on-chain metrics suggest a potential upward breakout. However, this move would not be straightforward and could punish impatient investors.
Week ahead – Hawkish risk as Fed and NFP on tap, Eurozone data eyed too

Fed meets on Wednesday as US inflation stays elevated. Will Friday’s jobs report bring relief or more angst for the markets? Eurozone flash GDP and CPI numbers in focus for the Euro.