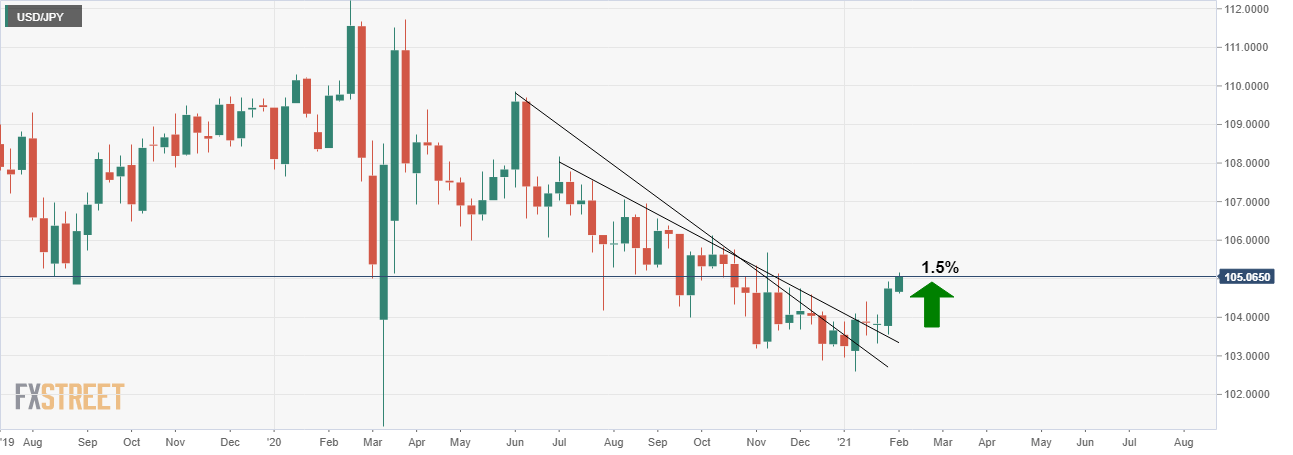
- USD/JPY is starting to decelerate on the daily and 4-hour time frames.
- Bulls may still have an appetite towards the 106 area.
- A correction of the massive bullish impulse is inevitable, but it is still too bullish to presume an imminent reversal.
JPY net long positions had dropped after their recent push to the highest levels since October 2016 which is transpired in the spot market following a breakout of the longterm bearish dynamic resistance.
(Daily Chart).
The unwind in the yen could be related to a behind the scenes reflation trade as outflows head into to higher-yielding foreign assets.
Nevertheless, the technical picture is compelling and the following is a top-down analysis that illustrates where the next trading opportunity could be derived from a swing trading perspective.
Monthly chart
The monthly chart is showing a strong resistance area where the price was supported numerous times in the past.
This would be expected to now act as resistance.
However, it is worth noting that within the monthly bearish trend, there is one candle that is opposing, which for ease of identifying, it has been eclipsed on the above chart.
Interestingly, this candle is inline with the 38.2% and 50% Fibonacci's of the bearish trend and could well be targetted yet at 105.74.
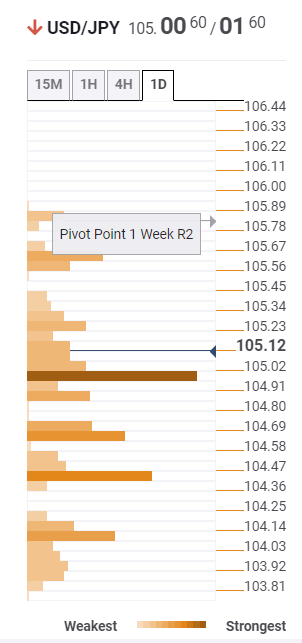
It is also the last stop on the daily and weekly chart in terms of confluences of the daily pivot point and weekly R2.
Below this is shown on the FXStreet Technical Confluences Indicator:
About Confluence Detector
The TCI (Technical Confluences Indicator) is a tool to locate and point out those price levels where there is a congestion of indicators, moving averages, Fibonacci levels, Pivot Points, etc. Knowing where these congestion points are located is very useful for the trader, and can be used as a basis for different strategies.
Weekly chart
The weekly chart shows the prior highs are a little higher up, but we can be assured that the 105.70/10 area is going to be critical and could ignite strong supply.
Daily chart
The daily chart is showing signs of deceleration of the massive bullish impulse, but there is still some way to go until the Supply Zone and said levels on the monthly and weekly time frames.
Nevertheless, should the price fail to move higher, and start the correction prematurely, then as it stands, the Fibonacci levels of the current daily bullish impulse's range align with prior resistance looking left.
A 38.2% Fibonacci aligns with the 10th Dec highs at 104.58 and the 50% with the 11th Jan highs of 104.40.
4-hour chart
The 4-hour chart shows the deceleration of price and momentum at a confluence of the top of the Bollinger Band that meets R1.
If the price can break here, then the upside targets will be the focus for a higher level to short from to target at least a 38.2% Fibo of the weekly rally.
On the other hand, if a convincing bearish structure is formed, then a lower probability trade can target the same downside levels.
Information on these pages contains forward-looking statements that involve risks and uncertainties. Markets and instruments profiled on this page are for informational purposes only and should not in any way come across as a recommendation to buy or sell in these assets. You should do your own thorough research before making any investment decisions. FXStreet does not in any way guarantee that this information is free from mistakes, errors, or material misstatements. It also does not guarantee that this information is of a timely nature. Investing in Open Markets involves a great deal of risk, including the loss of all or a portion of your investment, as well as emotional distress. All risks, losses and costs associated with investing, including total loss of principal, are your responsibility. The views and opinions expressed in this article are those of the authors and do not necessarily reflect the official policy or position of FXStreet nor its advertisers. The author will not be held responsible for information that is found at the end of links posted on this page.
If not otherwise explicitly mentioned in the body of the article, at the time of writing, the author has no position in any stock mentioned in this article and no business relationship with any company mentioned. The author has not received compensation for writing this article, other than from FXStreet.
FXStreet and the author do not provide personalized recommendations. The author makes no representations as to the accuracy, completeness, or suitability of this information. FXStreet and the author will not be liable for any errors, omissions or any losses, injuries or damages arising from this information and its display or use. Errors and omissions excepted.
The author and FXStreet are not registered investment advisors and nothing in this article is intended to be investment advice.
Recommended content
Editors’ Picks
EUR/USD trades above 1.0700 after EU inflation data

EUR/USD regained its traction and climbed above 1.0700 in the European session. Eurostat reported that the annual Core HICP inflation edged lower to 2.7% in April from 2.9% in March. This reading came in above the market expectation of 2.6% and supported the Euro.
GBP/USD recovers to 1.2550 despite US Dollar strength

GBP/USD is recovering losses to trade near 1.2550 in the European session on Tuesday. The pair rebounds despite a cautious risk tone and broad US Dollar strength. The focus now stays on the mid-tier US data amid a data-light UK docket.
Gold price remains depressed near $2,320 amid stronger USD, ahead of US macro data

Gold price (XAU/USD) remains depressed heading into the European session on Tuesday and is currently placed near the lower end of its daily range, just above the $2,320 level.
XRP hovers above $0.51 as Ripple motion to strike new expert materials receives SEC response

Ripple (XRP) trades broadly sideways on Tuesday after closing above $0.51 on Monday as the payment firm’s legal battle against the US Securities and Exchange Commission (SEC) persists.
Mixed earnings for Europe as battle against inflation in UK takes step forward

Corporate updates are dominating this morning after HSBC’s earnings report contained the surprise news that its CEO is stepping down after 5 years in the job. However, HSBC’s share price is rising this morning and is higher by nearly 2%.


