|

USD/JPY Price Analysis: Bulls looking to run through the 114 area

  • USD/JPY bulls moving in and eye a restest towards 115.20. 
  • On the downside, 112.50 is an important level worth noting. 

USD/JPY has corrected to into hourly support which gives rise to bullish prospects for the sessions ahead. The following illustrates, in a top-down analysis, the potential for a restest of the 114 area towards 115.20.

USD/JPY weekly chart

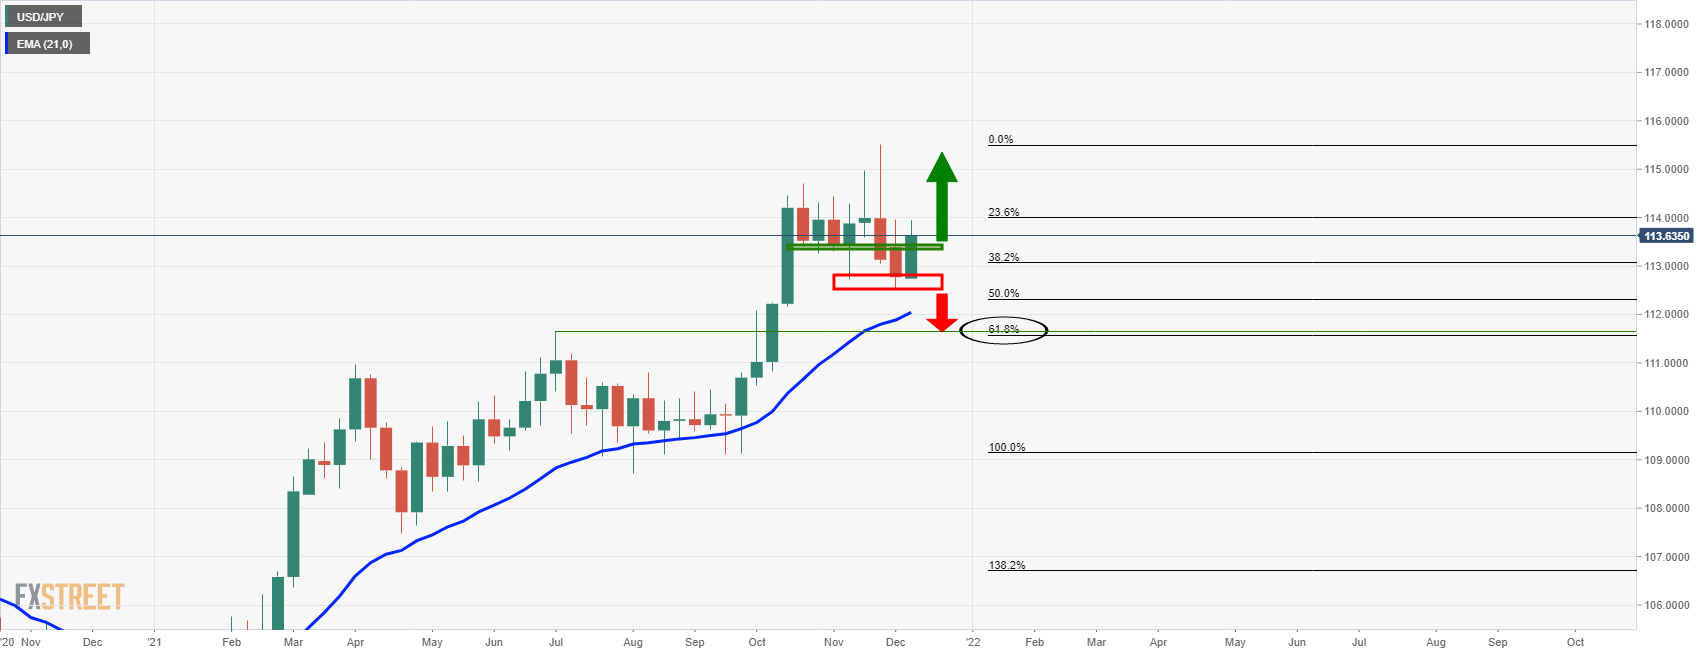
As per the weekly chart, the price has cleared last week's opening level and the prior week's support. This has given the bulls the edge and an upside continuation could be expected for the forthcoming days. A bullish close for the week will underpin the bullish bias. 

With that being said, a break of the lows, near 112.50, will likely give rise to a downside continuation. This will bring in the July highs near 111.65 that have a confluence with the 61.8% Fibonacci retracement of the bullish weekly impulse and the 21-EMA.

USD/JPY daily chart

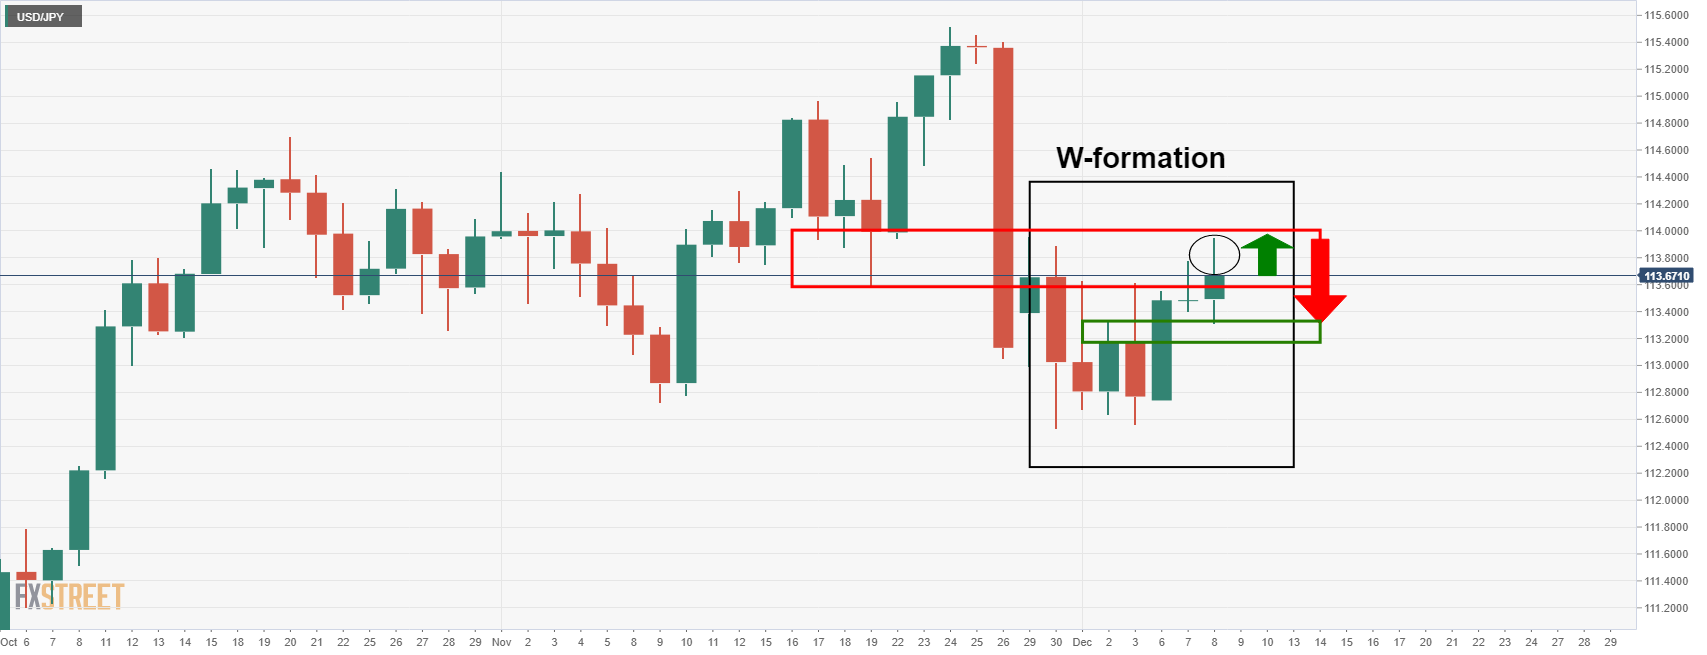
The daily chart is showing that the price has formed a W-formation, more easily visualized on a line chart, as follows:

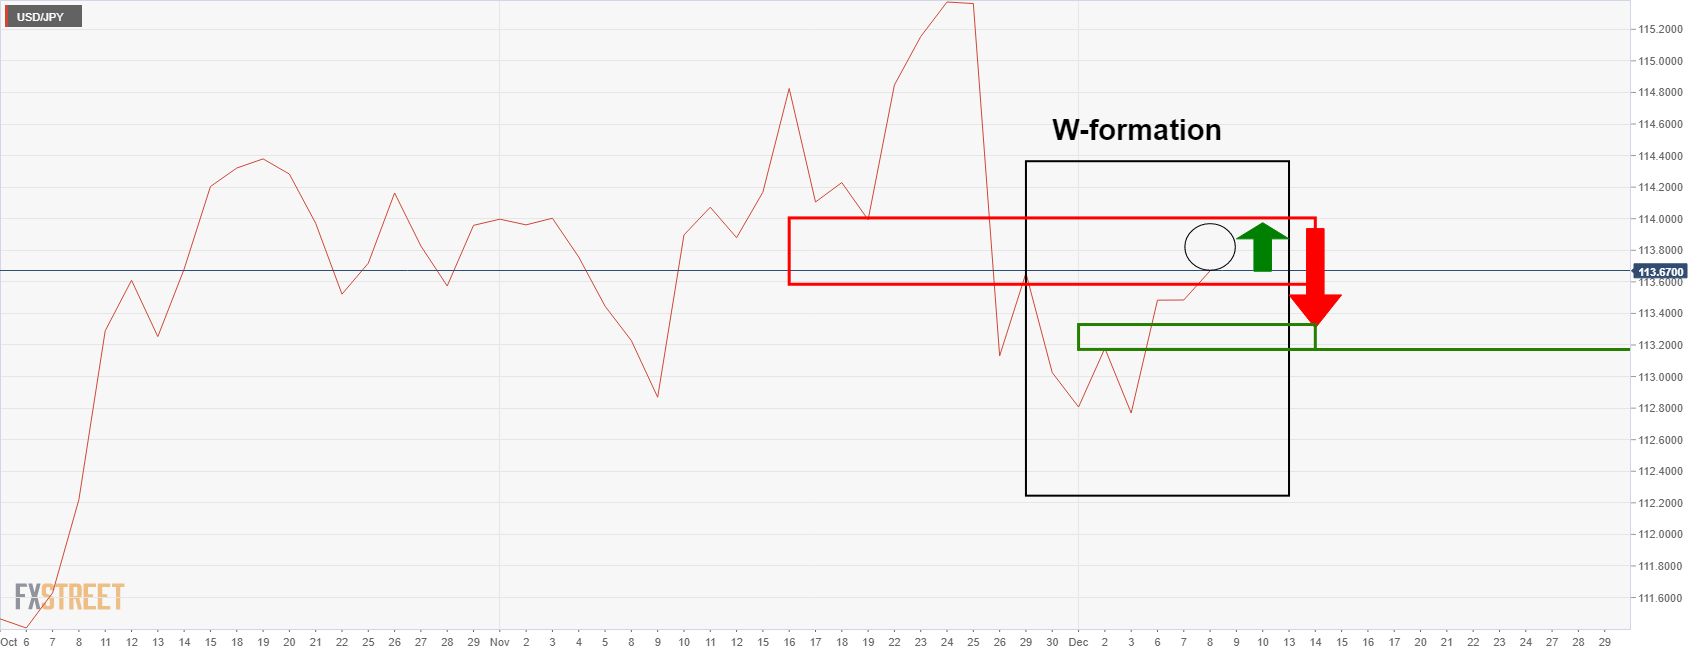
The W-formation is a reversion bearish pattern, and the price would be expected to retest the neckline of the W which comes in near 113.20/35 (including the Dec 2 wick) in this specific case. 

However, there is potential for the wick of today's business and candle to be filled on the lower time frames as the eclipse in the above images show:

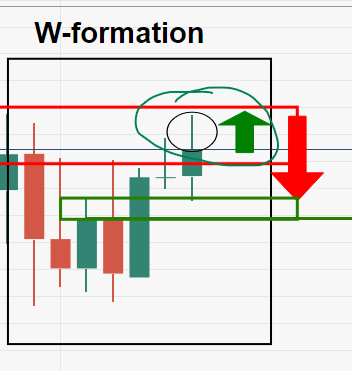
This gives rise to the potential for a restest of the resistance in the forthcoming sessions as follows:

USD/JPY H1 chart

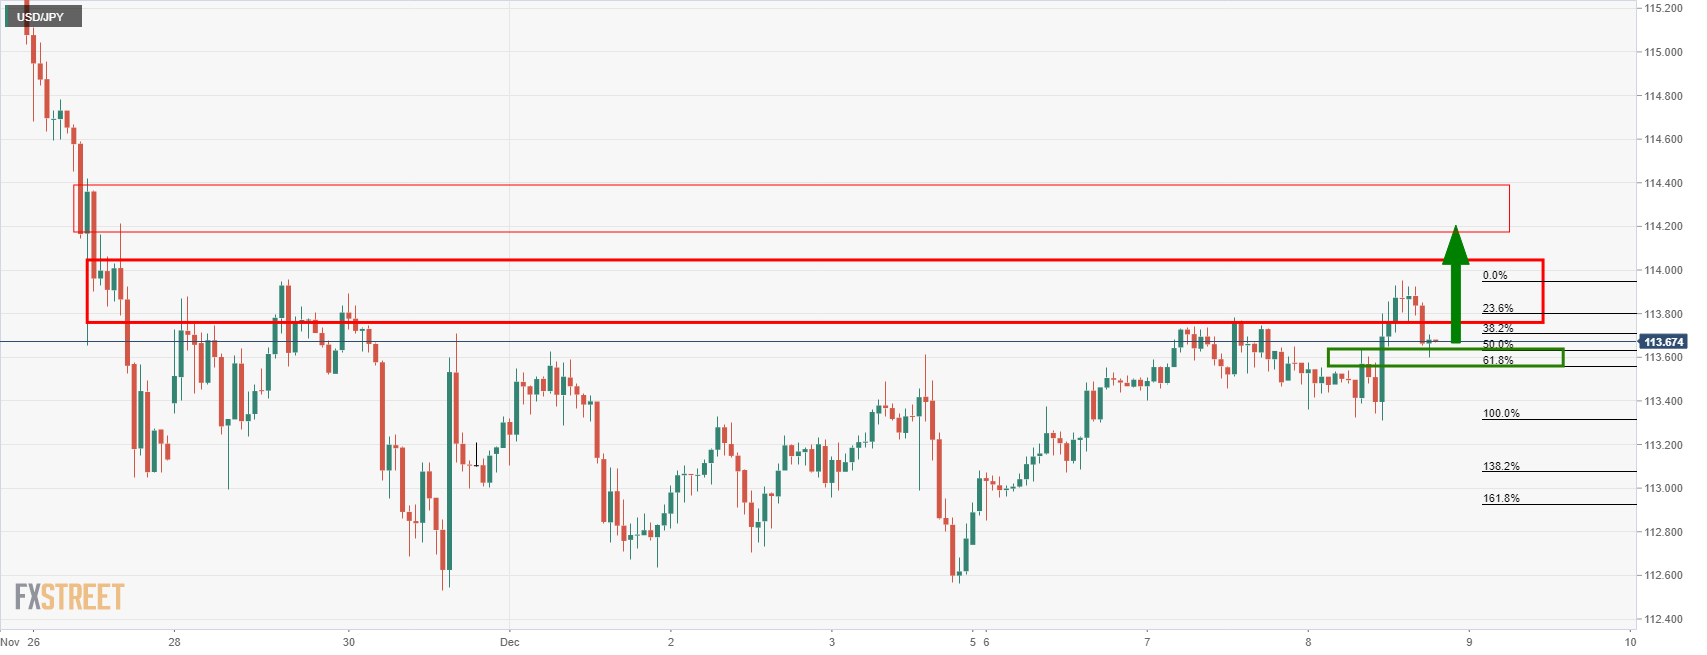
The latest hourly bearish candle, however, was a strong move and close, so the bulls would be prudent to wait on the sidelines to see how the price action develops over the coming hours. If the price recovers significantly, the imbalance on the daily chart's prior sell-off is with noting for upside potential to clear through low supply area between 114 and 115.20. 

Author

Ross J Burland

Ross J Burland, born in England, UK, is a sportsman at heart. He played Rugby and Judo for his county, Kent and the South East of England Rugby team.

More from Ross J Burland
Share:

Editor's Picks

AUD/USD looks weaker, focus is back to 0.7100

AUD/USD reverses Tuesday’s gains and retreats markedly toward four-day troughs in the low 0.7100s ahead of the opening bell in Asia. The firmer tone in the Greenback weighs on the risk complex amid unabated tensions on the US-Iran front, prompting the Aussie to shed part of recent gains and refocus on the downside. Moving forward, Australian trade balance results should entertain investors early on Thursday.

Japanese Yen bounces up from lows after Japan PM Takaichi’s intervention warnings

The Japanese Yen bounced up from five-week lows against the US Dollar, turning positive on the daily chart, as Japan’s Prime Minister Sanae Takaichi warned that Tokyo is ready to take action against Yen weakness. The USD/JPY pair has pulled back from the 160.00 level, considered a line in the sand for Japanese authorities, to hit session lows at 159.55.

Gold remains under bearish pressure, looks at $4,400

Gold keeps the offered stance well in place, retreating toward the $4,430 region per troy ounce, or four-day lows, on Wednesday. The yellow metal’s retracement comes in response to escalating tensions in the Middle East, which in turn continue to drive oil prices higher while reinforcing the idea of a tighter-for-longer Fed.


XRP eyes rebound despite muted ETF demand
Ripple (XRP) rebounds above $1.23 from support at $1.20 at the time of writing on Wednesday, as the broader cryptocurrency market pares losses triggered by escalating tensions in the Middle East. Appetite for risk assets remains generally low as the United States (US) and Iran exchange fire amid a fragile ceasefire and peace negotiations.
The upside-down math of debt
In 2010, Professors Carmen Reinhart and Kenneth Rogoff published a paper, Growth in a Time of Debt, which instantly went viral. The main thesis of the paper was that once a government's debt-to-GDP ratio crosses above 90%, a financial crisis and default are around the corner.
Recession on paper: What really moves the Canadian Loonie now?

Statistics Canada handed the headline writers a gift and the analysts a headache. Real GDP shrank 0.1% on an annualized basis in the first quarter, and with the fourth quarter of 2025 revised down to a 1.0% contraction, that is two negative quarters in a row, the textbook definition of a technical recession and Canada's first since the pandemic.