|

USD/JPY Price Analysis: Bounces off 132.30 support confluence but upside remains elusive

  • USD/JPY rebounds from one-week-old ascending trend line, 100-SMA to reverse the week-start losses.
  • Bearish MACD signals, previous failures to cross 200-SMA keep sellers hopeful.
  • 50-SMA, 61.8% Fibonacci retracement acts as an extra filter to the south.

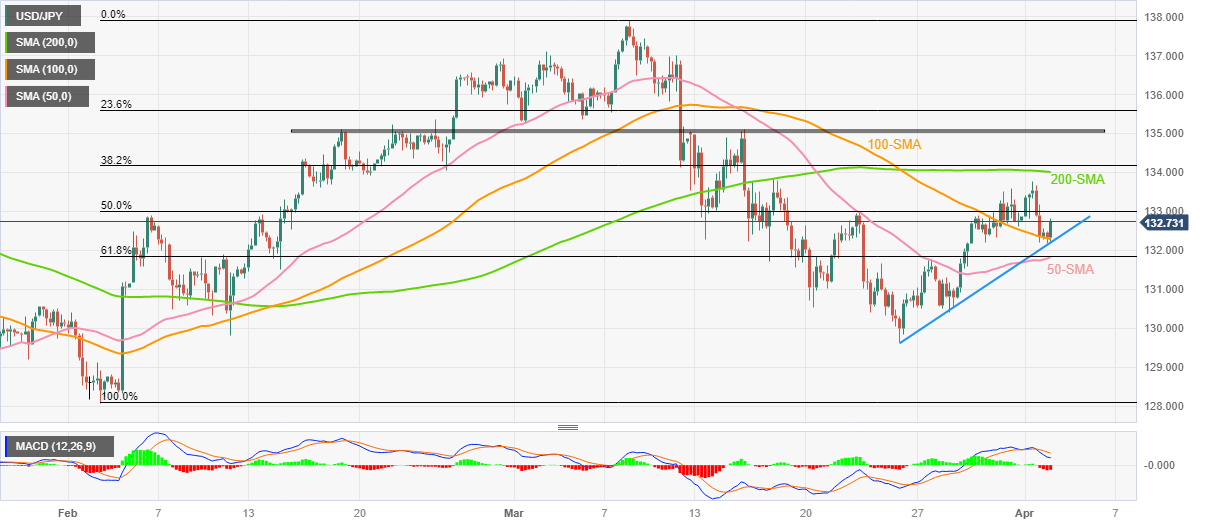
USD/JPY grinds near intraday high of around 132.80 during early Tuesday, following the downbeat start of the key week. In doing so, the Yen pair bounces from a convergence of the 100-bar Simple Moving Average (SMA) and one-week-old ascending trend line to reverse the previous day’s losses.

Although the Yen pair rebounds from the 132.30 support confluence, bearish MACD signals and the failure to cross the 200-SMA, around 134.00 by the press time, challenge the bulls.

Even if the USD/JPY crosses the 134.00 hurdle, a six-week-long horizontal resistance area near 135.10 can restrict the upside moves. It’s worth noting that 135.40 and 136.00 round figures are extra filters towards the north.

Should the quote remains firmer past 136.00, the odds of witnessing a fresh Year-To-Date high, currently around 137.90, can’t be ruled out.

On the flip side, a clear break of the 132.30 support confluence becomes necessary for the USD/JPY bear’s return.

Even so, the 61.8% Fibonacci retracement level of the USD/JPY pair’s February-March upside and 50-SMA, near 131.80, can act as the last defense of the buyers.

Following that, the 130.00 round figure and the previous monthly low near 129.65 may gain the USD/JPY seller’s attention.

Overall, USD/JPY is likely to extend the latest rebound but the recovery moves have limited upside room to cheer.

USD/JPY: Four-hour chart

Trend: Pullback expected

Additional important levels

Overview
Today last price132.71
Today Daily Change0.30
Today Daily Change %0.23%
Today daily open132.41
 
Trends
Daily SMA20133.09
Daily SMA50132.98
Daily SMA100133.8
Daily SMA200137.3
 
Levels
Previous Daily High133.76
Previous Daily Low132.2
Previous Weekly High133.6
Previous Weekly Low130.41
Previous Monthly High137.91
Previous Monthly Low129.64
Daily Fibonacci 38.2%132.8
Daily Fibonacci 61.8%133.16
Daily Pivot Point S1131.82
Daily Pivot Point S2131.24
Daily Pivot Point S3130.27
Daily Pivot Point R1133.38
Daily Pivot Point R2134.34
Daily Pivot Point R3134.93

Author

Anil Panchal

Anil Panchal

FXStreet

Anil Panchal has nearly 15 years of experience in tracking financial markets. With a keen interest in macroeconomics, Anil aptly tracks global news/updates and stays well-informed about the global financial moves and their implications.

More from Anil Panchal
Share:

Markets move fast. We move first.

Orange Juice Newsletter brings you expert driven insights - not headlines. Every day on your inbox.

By subscribing you agree to our Terms and conditions.

Editor's Picks

EUR/USD struggles for direction amid USD gains

EUR/USD is trimming part of its earlier gains, coming under some mild downside pressure near 1.1730 as the US Dollar edges higher. Markets are still digesting the Fed’s latest rate decision, while also looking ahead to more commentary from Fed officials in the sessions ahead.

GBP/USD drops to daily lows near 1.3360

Disappointing UK data weighed on the Sterling towards the end of the week, triggering a pullback in GBP/USD to fresh daily lows near 1.3360. Looking ahead, the next key event across the Channel is the BoE meeting on December 18.

Gold losses momentum, challenges $4,300

Gold now gives away some gains and disputes the key $4,300 zone per troy ounce following earlier multi-week highs. The move is being driven by expectations that the Fed will deliver further rate cuts next year, with the yellow metal climbing despite a firmer Greenback and rising US Treasury yields across the board.

Litecoin Price Forecast: LTC struggles to extend gains, bullish bets at risk

Litecoin (LTC) price steadies above $80 at press time on Friday, following a reversal from the $87 resistance level on Wednesday. Derivatives data suggests a bullish positional buildup while the LTC futures Open Interest declines, flashing a long squeeze risk.

Big week ends with big doubts

The S&P 500 continued to push higher yesterday as the US 2-year yield wavered around the 3.50% mark following a Federal Reserve (Fed) rate cut earlier this week that was ultimately perceived as not that hawkish after all. The cut is especially boosting the non-tech pockets of the market.

Aave Price Forecast: AAVE primed for breakout as bullish signals strengthen

Aave (AAVE) price is trading above $204 at the time of writing on Friday and approaching the upper boundary of its descending parallel channel; a breakout from this structure would favor the bulls.