USD/JPY ends the week down 2%, pinned to 142.00 after mid-week Fed pivot
- USD/JPY is down almost 2% from Monday’s opening bids.
- A pivot from the Fed saw the US Dollar decline sharply across the broader forex market.
- Next week pits the BoJ’s last rate call of the year against US GDP & PCE figures.

The USD/JPY wrapped up the trading week struggling to develop momentum in either direction from the 142.00 handle after the US Dollar (USD) slumped against the Japanese Yen (JPY) following a mid-week pivot from the US Federal Reserve (Fed), with the central bank finally meeting market participants in the middle on rate cut expectations heading into 2024.
The Fed’s dot plot of policymakers’ cumulative interest rate expectations next year sees the Fed expecting a median of three rate cuts for a total of 75 basis points in rate cuts from the Fed’s current reference rate of 5.5%. While the Fed has moved closer to market expectations, money markets have run well ahead of the Fed’s policy stance, with swaps markets pricing in an eye-watering six rate cuts in 2024, for a combined cut forecast over 150 basis points.
Forex Today: Dollar tumbles on Fed's pivot despite US economy still outperforming
The Fed’s pivot on rate policy sparked a risk rally that pushed the USD into the floorboards to end the week as the single-worst performing currency of the fx majors bloc, shedding weight across the board and finishing the week nearly two percent off of Monday’s opening bids against the Japanese Yen.
Next week kicks things off for the USD/JPY with the Bank of Japan’s (BoJ) final rate call and Monetary Policy Statement for 2023. An exact start time to the elusive BoJ’s rate statement is difficult to nail down, but the Japanese central bank is broadly expected to hold its main reference rate slightly below zero, in negative territory at -0.1%.
Next week also sees a fresh reading of the US’ Gross Domestic Product (GDP) on Thursday, and investors will be keeping a close eye on next Friday’s Personal Consumption Expenditure (PCE) figures. As the Fed’s favored method of tracking consumer-facing inflation, the PCE will go a long way to markets adjusting their rate expectations heading into 2024.
US Dollar price this week
The table below shows the percentage change of US Dollar (USD) against listed major currencies this week. US Dollar was the weakest against the Japanese Yen.
| USD | EUR | GBP | CAD | AUD | JPY | NZD | CHF | |
| USD | -1.22% | -1.00% | -1.54% | -1.84% | -1.92% | -1.41% | -1.07% | |
| EUR | 1.19% | 0.21% | -0.32% | -0.63% | -0.72% | -0.19% | 0.14% | |
| GBP | 1.00% | -0.22% | -0.53% | -0.83% | -0.92% | -0.40% | -0.07% | |
| CAD | 1.52% | 0.33% | 0.52% | -0.31% | -0.39% | 0.13% | 0.46% | |
| AUD | 1.82% | 0.62% | 0.83% | 0.31% | -0.09% | 0.44% | 0.77% | |
| JPY | 1.90% | 0.70% | 0.84% | 0.39% | 0.09% | 0.52% | 0.85% | |
| NZD | 1.39% | 0.18% | 0.40% | -0.13% | -0.43% | -0.52% | 0.33% | |
| CHF | 1.06% | -0.15% | 0.06% | -0.46% | -0.75% | -0.82% | -0.33% |
The heat map shows percentage changes of major currencies against each other. The base currency is picked from the left column, while the quote currency is picked from the top row. For example, if you pick the Euro from the left column and move along the horizontal line to the Japanese Yen, the percentage change displayed in the box will represent EUR (base)/JPY (quote).
USD/JPY Technical Outlook
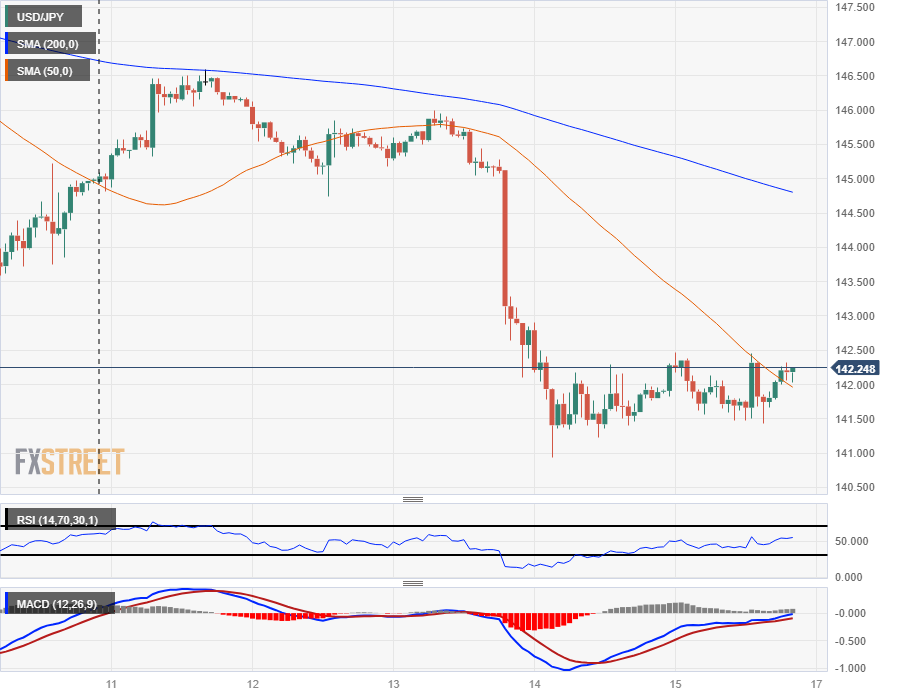
The USD/JPY saw a hard rebalance on Wednesday, dragging the pair back down to the 141.00 handle before the Dollar leveled out to end the trading week just above the 142.00 price point.
The pair saw a peak-to-trough decline of 3.85% on the week, and the Dollar’s decline and minuscule rebound sees the USD/JPY trading far below the 200-hour Simple Moving Average (SMA) descending through the 145.00 major handle.
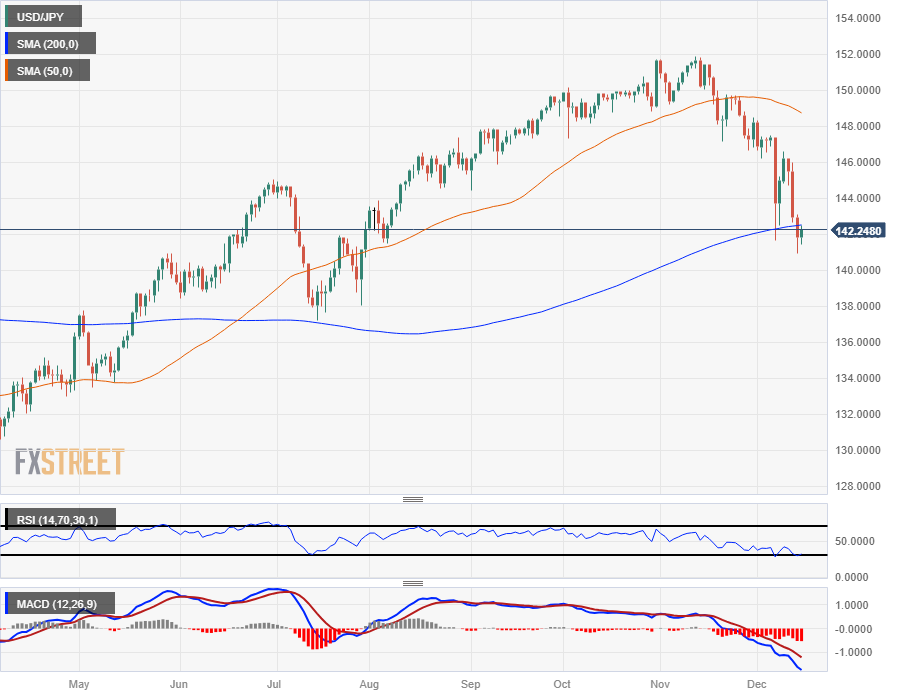
The USD/JPY’s declines have dragged the pair back into the 200-day SMA for the first time since breaking through the moving average back in May of this year, and the pair is down over seven percent from the year’s peak bids at 151.83 back in November.
Despite this, Greenback bidders will be able to walk away happy: the USD is still up nearly 8% against the JPY for 2023, having started the year near the 131.00 handle.
USD/JPY Hourly Chart
USD/JPY Daily Chart
USD/JPY Technical Levels
Author

Joshua Gibson
FXStreet
Joshua joins the FXStreet team as an Economics and Finance double major from Vancouver Island University with twelve years' experience as an independent trader focusing on technical analysis.
















