USD/JPY embarks on a significant correction below key daily support


  • USD/JPY bears sink in their teeth on lower US yields, stocks and a heightened sense of risk aversion.
  • Bears break below critical support, bucking the trend of bullish flag breakouts. 

USD/JPY fell on Thursday to a low of 127.51 from a high of 130.05. A combination of lower US yields and global shares are at their lowest point in 18-months has been supporting both the greenback to a fresh 20-year-high and the yen that has moved out of bearish territory vs. the US dollar.

As a consequence of the risk-off sentiment, the DXY, an index that measures the US dollar vs. a basket of rivals is trading at a new cycle high of 104.925, carving out the way towards the 2002 high near 107. However, the yen has caught a bid also, rallying to its way out of a bullish structure on the daily chart. 

Benchmark 10-year Treasury yields, which hit the lowest level in two weeks are down over 3% while the more Fed tentative 2-years are losing 3.7%, weighed by Producer Prices that fell short of expectations. The US Producer Price Index increased by 0.5% in April compared with a 1.6% jump in March. Excluding food and energy, the core PPI climbed by 0.4%, lagging the 0.7% gain expected. Core PPI grew by 1.2% in March. On a year-over-year basis, producer price inflation surged 11% in April, and core PPI jumped 8.8%, the Bureau of Labor Statistics said Thursday.

Meanwhile, the summary of opinions from the April 27-28 Bank of Japan meeting came across as universally dovish and largely unconcerned about rising inflation and the weak yen.  The Next policy meeting is June 16-17 and all signs point to continued dovishness from the BOJ.

USD/JPY technical analysis

The pair has bucked the trend on Thursday, breaking below prior support and has denied the bulls that were otherwise seeking more from the bullish flag pattern on the daily chart:

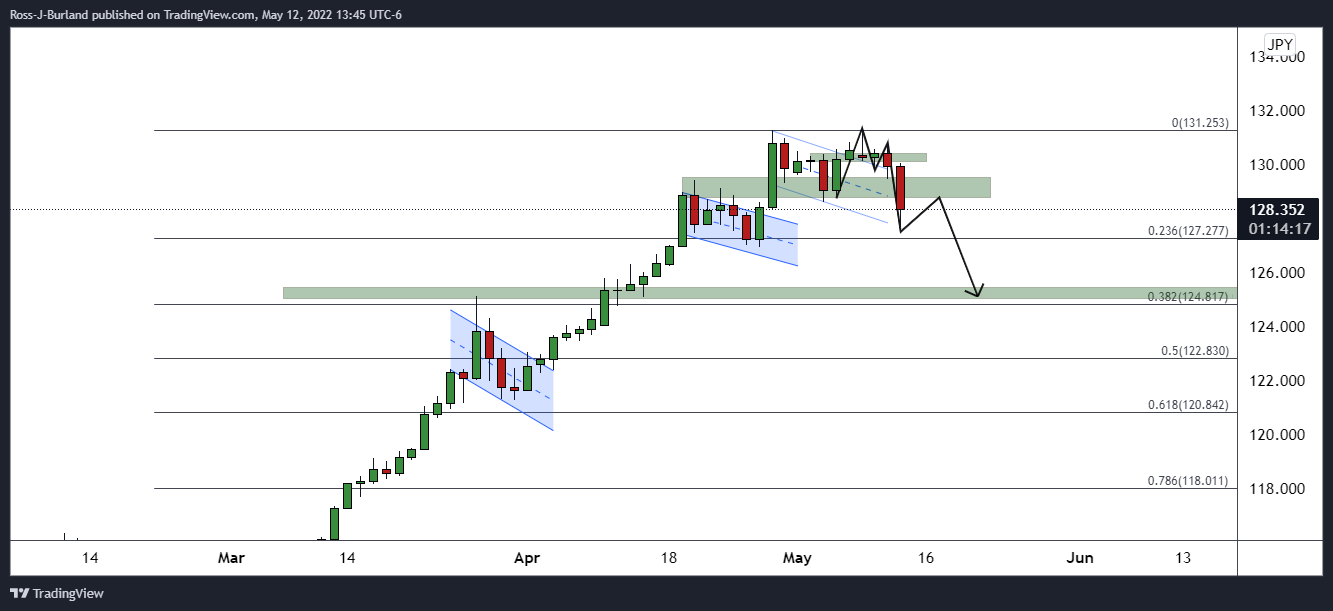
The price action has left an M-formation on the daily chart, a pattern which often sees the price reverting to restest the prior lows, or the neckline of the chart pattern. 

Share: Feed news

Information on these pages contains forward-looking statements that involve risks and uncertainties. Markets and instruments profiled on this page are for informational purposes only and should not in any way come across as a recommendation to buy or sell in these assets. You should do your own thorough research before making any investment decisions. FXStreet does not in any way guarantee that this information is free from mistakes, errors, or material misstatements. It also does not guarantee that this information is of a timely nature. Investing in Open Markets involves a great deal of risk, including the loss of all or a portion of your investment, as well as emotional distress. All risks, losses and costs associated with investing, including total loss of principal, are your responsibility. The views and opinions expressed in this article are those of the authors and do not necessarily reflect the official policy or position of FXStreet nor its advertisers. The author will not be held responsible for information that is found at the end of links posted on this page.

If not otherwise explicitly mentioned in the body of the article, at the time of writing, the author has no position in any stock mentioned in this article and no business relationship with any company mentioned. The author has not received compensation for writing this article, other than from FXStreet.

FXStreet and the author do not provide personalized recommendations. The author makes no representations as to the accuracy, completeness, or suitability of this information. FXStreet and the author will not be liable for any errors, omissions or any losses, injuries or damages arising from this information and its display or use. Errors and omissions excepted.

The author and FXStreet are not registered investment advisors and nothing in this article is intended to be investment advice.

Recommended content


Recommended content

Editors’ Picks

EUR/USD retreats to 1.0700 after US data

EUR/USD retreats to 1.0700 after US data

EUR/USD lost its traction and turned negative on the day near 1.0700 in the American session on Tuesday. The data from the US showed that Employment Cost Index rose more than expected in Q1 and provided a boost to the USD.

EUR/USD News

GBP/USD declines toward 1.2500 on renewed USD strength

GBP/USD declines toward 1.2500 on renewed USD strength

GBP/USD turned south and dropped toward 1.2500 in the second half of the day. The US Dollar gathers strength following the strong wage inflation data, forcing the pair to stay on the back foot.

GBP/USD News

Gold extends daily slide toward $2,300 after US data

Gold extends daily slide toward $2,300 after US data

Gold stays under bearish pressure and declines toward $2,300 on Tuesday. The benchmark 10-year US Treasury bond yield stays in positive territory above 4.6% after US Employment Cost Index data, weighing on XAU/USD.

Gold News

XRP hovers above $0.51 as Ripple motion to strike new expert materials receives SEC response

XRP hovers above $0.51 as Ripple motion to strike new expert materials receives SEC response

Ripple (XRP) trades broadly sideways on Tuesday after closing above $0.51 on Monday as the payment firm’s legal battle against the US Securities and Exchange Commission (SEC) persists.

Read more

Eurozone inflation stable as the outlook on prices gets increasingly muddied

Eurozone inflation stable as the outlook on prices gets increasingly muddied

Eurozone headline inflation remains stable at 2.4%. With higher energy prices and improving domestic demand, questions about the direction of inflation become louder.

Read more

Forex MAJORS

Cryptocurrencies

Signatures