USD/JPY declines after weak US data, buyers take profits


  • The UoM Sentiment Index slipped to 77.9, indicating a weakening in US consumer confidence.
  • The US Dollar seems to consolidate weekly gains following hot inflation data.
  • The Greenback will close a 1.60% winning week.

The USD/JPY pair, currently trading at 152.95 with a modest loss of 0.17%. Despite a drop in consumer confidence in the US, indicated by the University of Michigan's (UoM) Consumer Sentiment Index the Greenback will close a winning week, on the back of hot inflation data reported on Wednesday and Thursday.

Consumer confidence in the US weakened in early April, with the  UoM's Consumer Sentiment Index edging lower to 77.9 from 79.4 in March. This reading came in below the market expectation of 79. The Current Conditions Index declined to 79.3 from 82.5 and the Consumer Expectations Index fell to 77 from 77.4. The details of the survey also revealed that the one-year inflation outlook climbed to 3.1% from 2.9% in April, while the five-year inflation outlook rose to 3% from 2.8%.

That being said, the US Bureau of Labor Statistics revealed a rise in inflation this week, with the Consumer Price Index (CPI), rising to 3.5% year-over-year in March, up from February's 3.2%. The core CPI, also increased to 3.8% Yoy, matching February's level. In that sense, hot inflation figures fueled a sharp rise in hawkish bets on the Federal Reserve (Fed) and in the US Treasury yields which benefited the USD during the week. As for now, markets seem to have given up on the hopes of a June rate cut and if data validated those bets, the USD may see further upside. Next Monday, the US will release Retail Sales figures from March.

USD/JPY technical analysis

On the daily chart, the USD/JPY pair reveals a sustained trend in positive territory on the Relative Strength Index (RSI). Even with the slight decrease observed back below 70, the dominant trend is bullish and buyers just seem to be correcting overbought conditions. Simultaneously, a reading of green bars on the Moving Average Convergence Divergence (MACD) histogram consolidates the buying momentum thesis.

USD/JPY daily chart

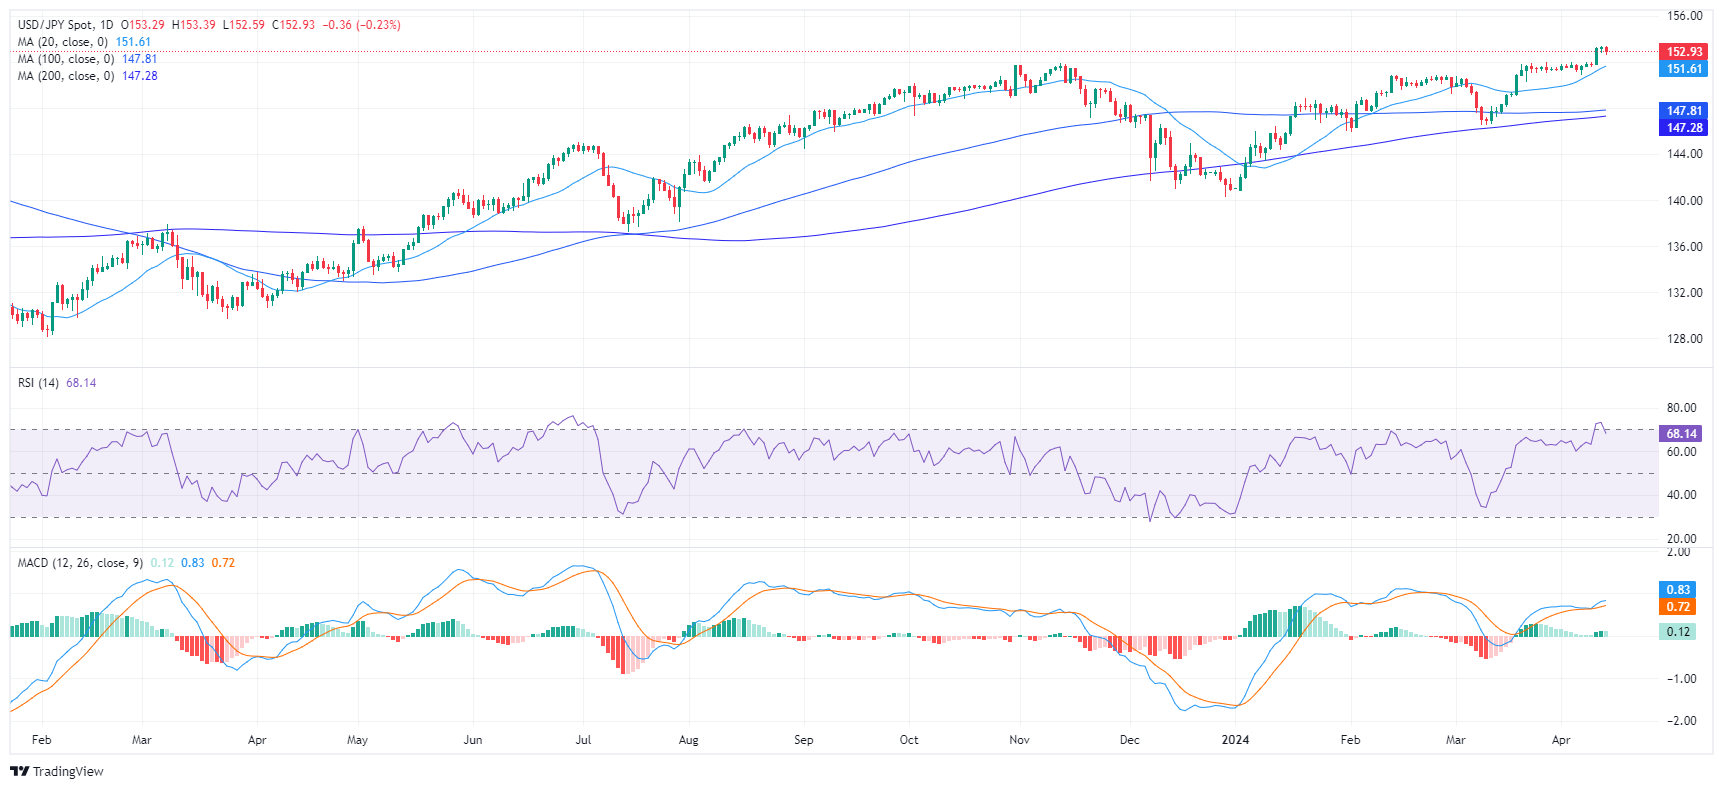
On examining the broader outlook, the USD/JPY reveals a bullish posture. The pair's position above the 20-day, 100-day, and 200-day Simple Moving Average (SMA) portrays a positive short-term and long-term trend.


USD/JPY

Overview
Today last price 153.04
Today Daily Change -0.24
Today Daily Change % -0.16
Today daily open 153.28
 
Trends
Daily SMA20 151.42
Daily SMA50 150.19
Daily SMA100 147.78
Daily SMA200 147.23
 
Levels
Previous Daily High 153.32
Previous Daily Low 152.76
Previous Weekly High 151.95
Previous Weekly Low 150.81
Previous Monthly High 151.97
Previous Monthly Low 146.48
Daily Fibonacci 38.2% 153.11
Daily Fibonacci 61.8% 152.97
Daily Pivot Point S1 152.92
Daily Pivot Point S2 152.56
Daily Pivot Point S3 152.36
Daily Pivot Point R1 153.48
Daily Pivot Point R2 153.68
Daily Pivot Point R3 154.04


Share: Feed news

Information on these pages contains forward-looking statements that involve risks and uncertainties. Markets and instruments profiled on this page are for informational purposes only and should not in any way come across as a recommendation to buy or sell in these assets. You should do your own thorough research before making any investment decisions. FXStreet does not in any way guarantee that this information is free from mistakes, errors, or material misstatements. It also does not guarantee that this information is of a timely nature. Investing in Open Markets involves a great deal of risk, including the loss of all or a portion of your investment, as well as emotional distress. All risks, losses and costs associated with investing, including total loss of principal, are your responsibility. The views and opinions expressed in this article are those of the authors and do not necessarily reflect the official policy or position of FXStreet nor its advertisers. The author will not be held responsible for information that is found at the end of links posted on this page.

If not otherwise explicitly mentioned in the body of the article, at the time of writing, the author has no position in any stock mentioned in this article and no business relationship with any company mentioned. The author has not received compensation for writing this article, other than from FXStreet.

FXStreet and the author do not provide personalized recommendations. The author makes no representations as to the accuracy, completeness, or suitability of this information. FXStreet and the author will not be liable for any errors, omissions or any losses, injuries or damages arising from this information and its display or use. Errors and omissions excepted.

The author and FXStreet are not registered investment advisors and nothing in this article is intended to be investment advice.

Recommended content


Recommended content

Editors’ Picks

AUD/USD retargets the 0.6600 barrier and above

AUD/USD retargets the 0.6600 barrier and above

AUD/USD extended its positive streak for the sixth session in a row at the beginning of the week, managing to retest the transitory 100-day SMA near 0.6580 on the back of the solid performance of the commodity complex.

AUD/USD News

EUR/USD keeps the bullish bias above 1.0700

EUR/USD keeps the bullish bias above 1.0700

EUR/USD rapidly set aside Friday’s decline and regained strong upside traction in response to the marked retracement in the Greenback following the still-unconfirmed FX intervention by the Japanese MoF.

EUR/USD News

Gold advances for a third consecutive day

Gold advances for a third consecutive day

Gold fluctuates in a relatively tight channel above $2,330 on Monday. The benchmark 10-year US Treasury bond yield corrects lower and helps XAU/USD limit its losses ahead of this week's key Fed policy meeting.

Gold News

Bitcoin price dips to $62K range despite growing international BTC validation via spot ETFs

Bitcoin price dips to $62K range despite growing international BTC validation via spot ETFs

Bitcoin (BTC) price closed down for four weeks in a row, based on the weekly chart, and could be on track for another red candle this week. The last time it did this was in the middle of the bear market when it fell by 42% within a span of nine weeks. 

Read more

Japan intervention: Will it work?

Japan intervention: Will it work?

Dear Japan Intervenes in the Yen for the first time since November 2022 Will it work? Have we seen a top in USDJPY? Let's go through the charts.

Read more

Forex MAJORS

Cryptocurrencies

Signatures