USD/INR edges lower as India sees strong growth in business
- Indian Rupee gains ground despite the firmer USD on Friday.
- India’s flash PMI showed a robust expansion in May, boosting the INR.
- US Durable Goods Order, Michigan Consumer Sentiment Index report, and speech from Fed’s Waller are the highlights on Friday.

Indian Rupee (INR) trades with a mild positive bias on Friday despite the rebound of the US Dollar (USD). The strong growth of India's business sector in May and the sharp exports and job addition rate provide some support to the INR. Additionally, a decline in crude oil prices underpins the local currency, as India is the world's third-biggest oil importer and consumer.
On Friday, investors will focus on the US Durable Goods Orders, the Michigan Consumer Sentiment Index, and the Fed’s Waller speech for fresh impetus. The stronger US economic data and hawkish remarks from Federal Reserve (Fed) officials might lift the Greenback and limit the downside for the pair. Also, the foreign outflows ahead of India's upcoming election outcome might also weigh on the INR.
Daily Digest Market Movers: Indian Rupee remains strong, supported by robust economic data
- India’s flash HSBC Composite PMI came in at 61.7 in May from 61.5 in April, reaching the third strongest reading in nearly 14 years and marking the 34th consecutive month above the 50-level, which separates growth from contraction.
- The Indian Manufacturing PMI dropped to 58.4 in May from 58.8 in April. The services PMI index rose to a four-month high of 61.4 in May from 60.8 in April.
- The preliminary US S&P Composite PMI came in better than market expectations, jumping to 54.4 in May from 51.3 in April, the highest level since April 2022.
- The US Manufacturing PMI rose to 50.9 in May versus 50.0 in April, above the market consensus of 50.0. The Services PMI jumped to 54.8 in May, better than the estimation and previous reading of 51.3.
- The US Initial Jobless Claims for the week ending May 18 declined to 215K from the previous week's reading of 223K, lower than the expectation of 220K.
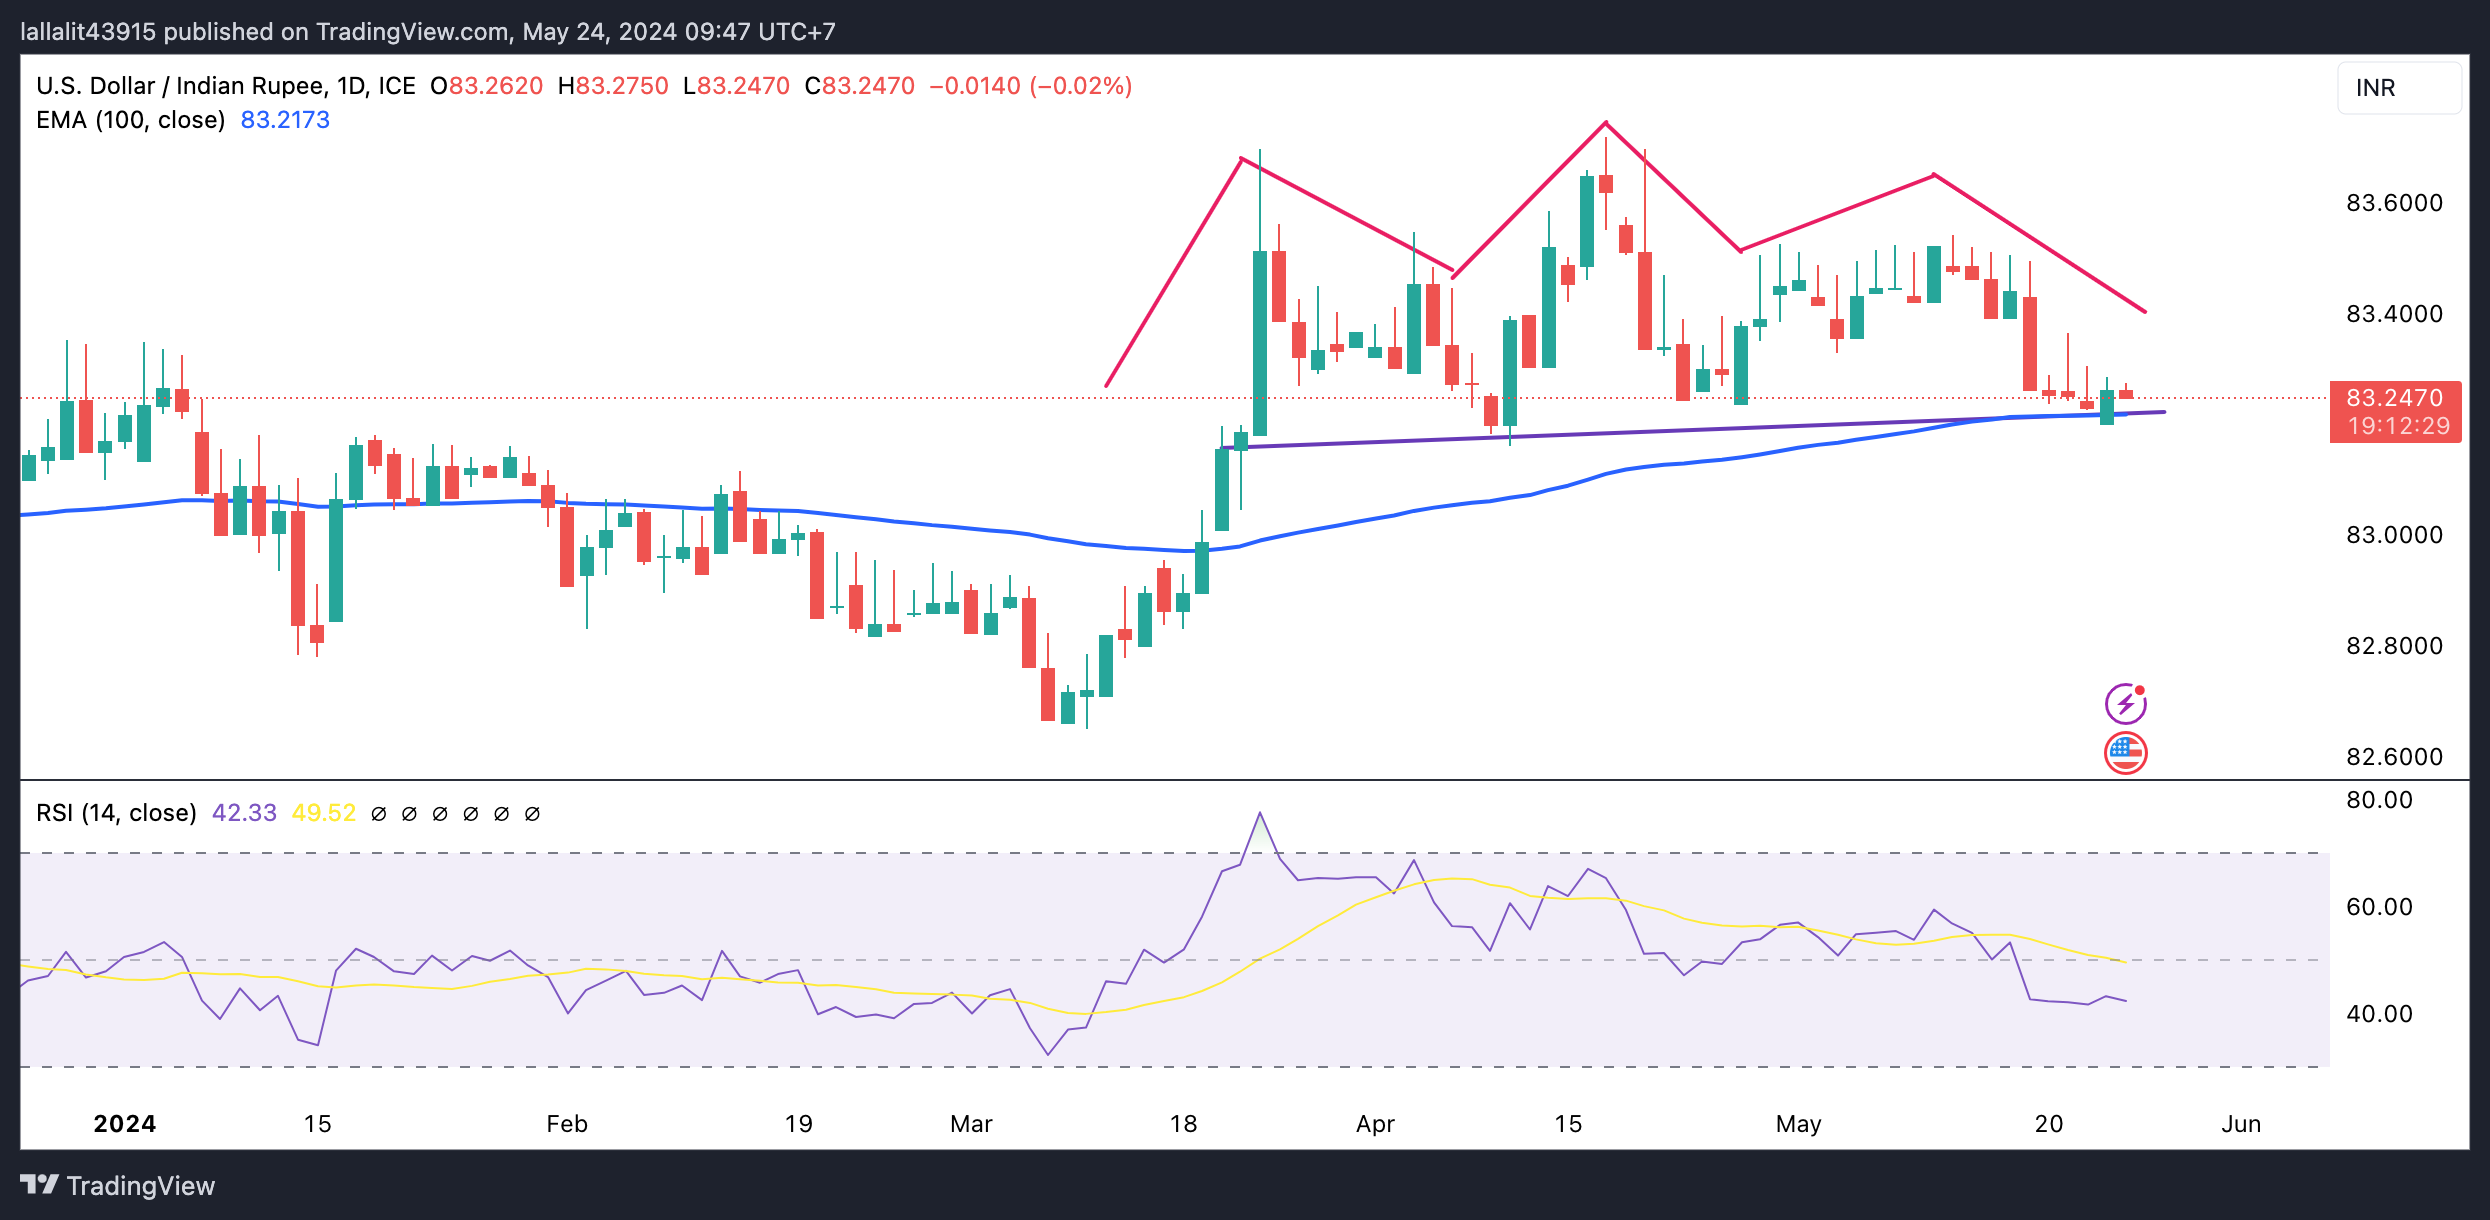
Technical analysis: USD/INR becomes more vulnerable on the daily timeframe
The confluence of the 100-day EMA and the neckline of 83.20 is the potential support level for USD/INR. A decisive closing price below this level could pave the way to the 83.00 psychological level and a low of January 15 at 82.78.
On the upside, any follow-through buying above the right shoulder of the Head and Shoulders pattern of 83.54 (high of May 13) would end up invalidating the chart pattern and attract some buyers to a high of April 17 at 83.72 en route to 84.00.
US Dollar price in the last 7 days
The table below shows the percentage change of US Dollar (USD) against listed major currencies in the last 7 days. US Dollar was the weakest against the Pound Sterling.
| USD | EUR | GBP | CAD | AUD | JPY | NZD | CHF | |
| USD | 0.53% | -0.14% | 0.88% | 1.24% | 1.08% | 0.48% | 1.00% | |
| EUR | -0.53% | -0.67% | 0.35% | 0.71% | 0.56% | -0.05% | 0.48% | |
| GBP | 0.15% | 0.68% | 1.01% | 1.38% | 1.21% | 0.60% | 1.14% | |
| CAD | -0.89% | -0.34% | -1.03% | 0.36% | 0.22% | -0.40% | 0.14% | |
| AUD | -1.27% | -0.73% | -1.41% | -0.37% | -0.17% | -0.78% | -0.25% | |
| JPY | -1.09% | -0.56% | -1.24% | -0.22% | 0.13% | -0.61% | -0.06% | |
| NZD | -0.48% | 0.05% | -0.63% | 0.40% | 0.76% | 0.60% | 0.53% | |
| CHF | -1.02% | -0.48% | -1.16% | -0.14% | 0.23% | 0.08% | -0.53% |
The heat map shows percentage changes of major currencies against each other. The base currency is picked from the left column, while the quote currency is picked from the top row. For example, if you pick the Euro from the left column and move along the horizontal line to the Japanese Yen, the percentage change displayed in the box will represent EUR (base)/JPY (quote).
RBI FAQs
The role of the Reserve Bank of India (RBI), in its own words, is '..to maintain price stability while keeping in mind the objective of growth.” This involves maintaining the inflation rate at a stable 4% level primarily using the tool of interest rates. The RBI also maintains the exchange rate at a level that will not cause excess volatility and problems for exporters and importers, since India’s economy is heavily reliant on foreign trade, especially Oil.
The RBI formally meets at six bi-monthly meetings a year to discuss its monetary policy and, if necessary, adjust interest rates. When inflation is too high (above its 4% target), the RBI will normally raise interest rates to deter borrowing and spending, which can support the Rupee (INR). If inflation falls too far below target, the RBI might cut rates to encourage more lending, which can be negative for INR.
Due to the importance of trade to the economy, the Reserve Bank of India (RBI) actively intervenes in FX markets to maintain the exchange rate within a limited range. It does this to ensure Indian importers and exporters are not exposed to unnecessary currency risk during periods of FX volatility. The RBI buys and sells Rupees in the spot market at key levels, and uses derivatives to hedge its positions.
Author

Lallalit Srijandorn
FXStreet
Lallalit Srijandorn is a Parisian at heart. She has lived in France since 2019 and now becomes a digital entrepreneur based in Paris and Bangkok.


