USD/INR trades with mild gains amid Middle East geopolitical risks
- Indian Rupee weakens on Monday despite the weaker USD.
- Strong inflows into Indian equities might support the INR in near term; geopolitical risks might cap the local currency’s upside.
- US Q1 GDP, US April PCE and Indian Q4 GDP growth numbers will be closely watched this week.

Indian Rupee (INR) trims gains on Monday despite the softer US Dollar (USD). The INR closed at a two-month high of 83.10 on Friday, marking its biggest weekly gain in over five months, bolstered by strong inflows into Indian equities. The continuing USD inflows into domestic equities could lift the INR in the near term. However, the rise of crude oil prices and safe-haven flows amid the rising geopolitical tensions in the Middle East might boost the Greenback and create a tailwind for USD/INR.
Investors will closely watch the first reading of US Gross Domestic Product (GDP) for the first quarter (Q1) of 2024 on Thursday and the final reading of the Personal Consumption Expenditures Price Index (PCE) for April on Friday. On the Indian docket, the GDP growth number for the fourth quarter of 2023 will be released on Friday. If the Indian economy shows a weaker-than-expected growth, this could weigh on the INR and cap the downside for the pair.
Daily Digest Market Movers: Indian Rupee edges lower amid the cautious mood
- The Indian Rupee strengthened by the most in five months, as India's benchmark equity indices, BSE Sensex and Nifty 50, touched record highs on Friday.
- After witnessing impressive growth rates of more than 8% for three consecutive quarters, India’s economic growth is estimated to moderate to a four-quarter low of 6.7% in the fourth quarter of 2023.
- At least 35 people have been killed after an Israeli airstrike in the southern Gaza city of Rafah hit tents housing displaced people, the Ministry of Health in Gaza said on Sunday, hours after Hamas launched a barrage of rockets at Tel Aviv for the first time in months, per the Guardian.
- The US Durable Goods Orders climbed by 0.7% MoM in April following a downwardly revised 0.8% advance in March. Economists had expected the figure to decrease by 0.8%.
- The University of Michigan Consumer Sentiment Index fell to 69.1 in May from 67.4 in April. Meanwhile, inflation expectations for one year rose slightly to 3.3% from 3.2%, while five-year inflation expectations dropped to 3% from 3.1%.
- Financial markets see the probability of unchanged rates rising to 46% from 35% a week earlier, according to CME's FedWatch tool.
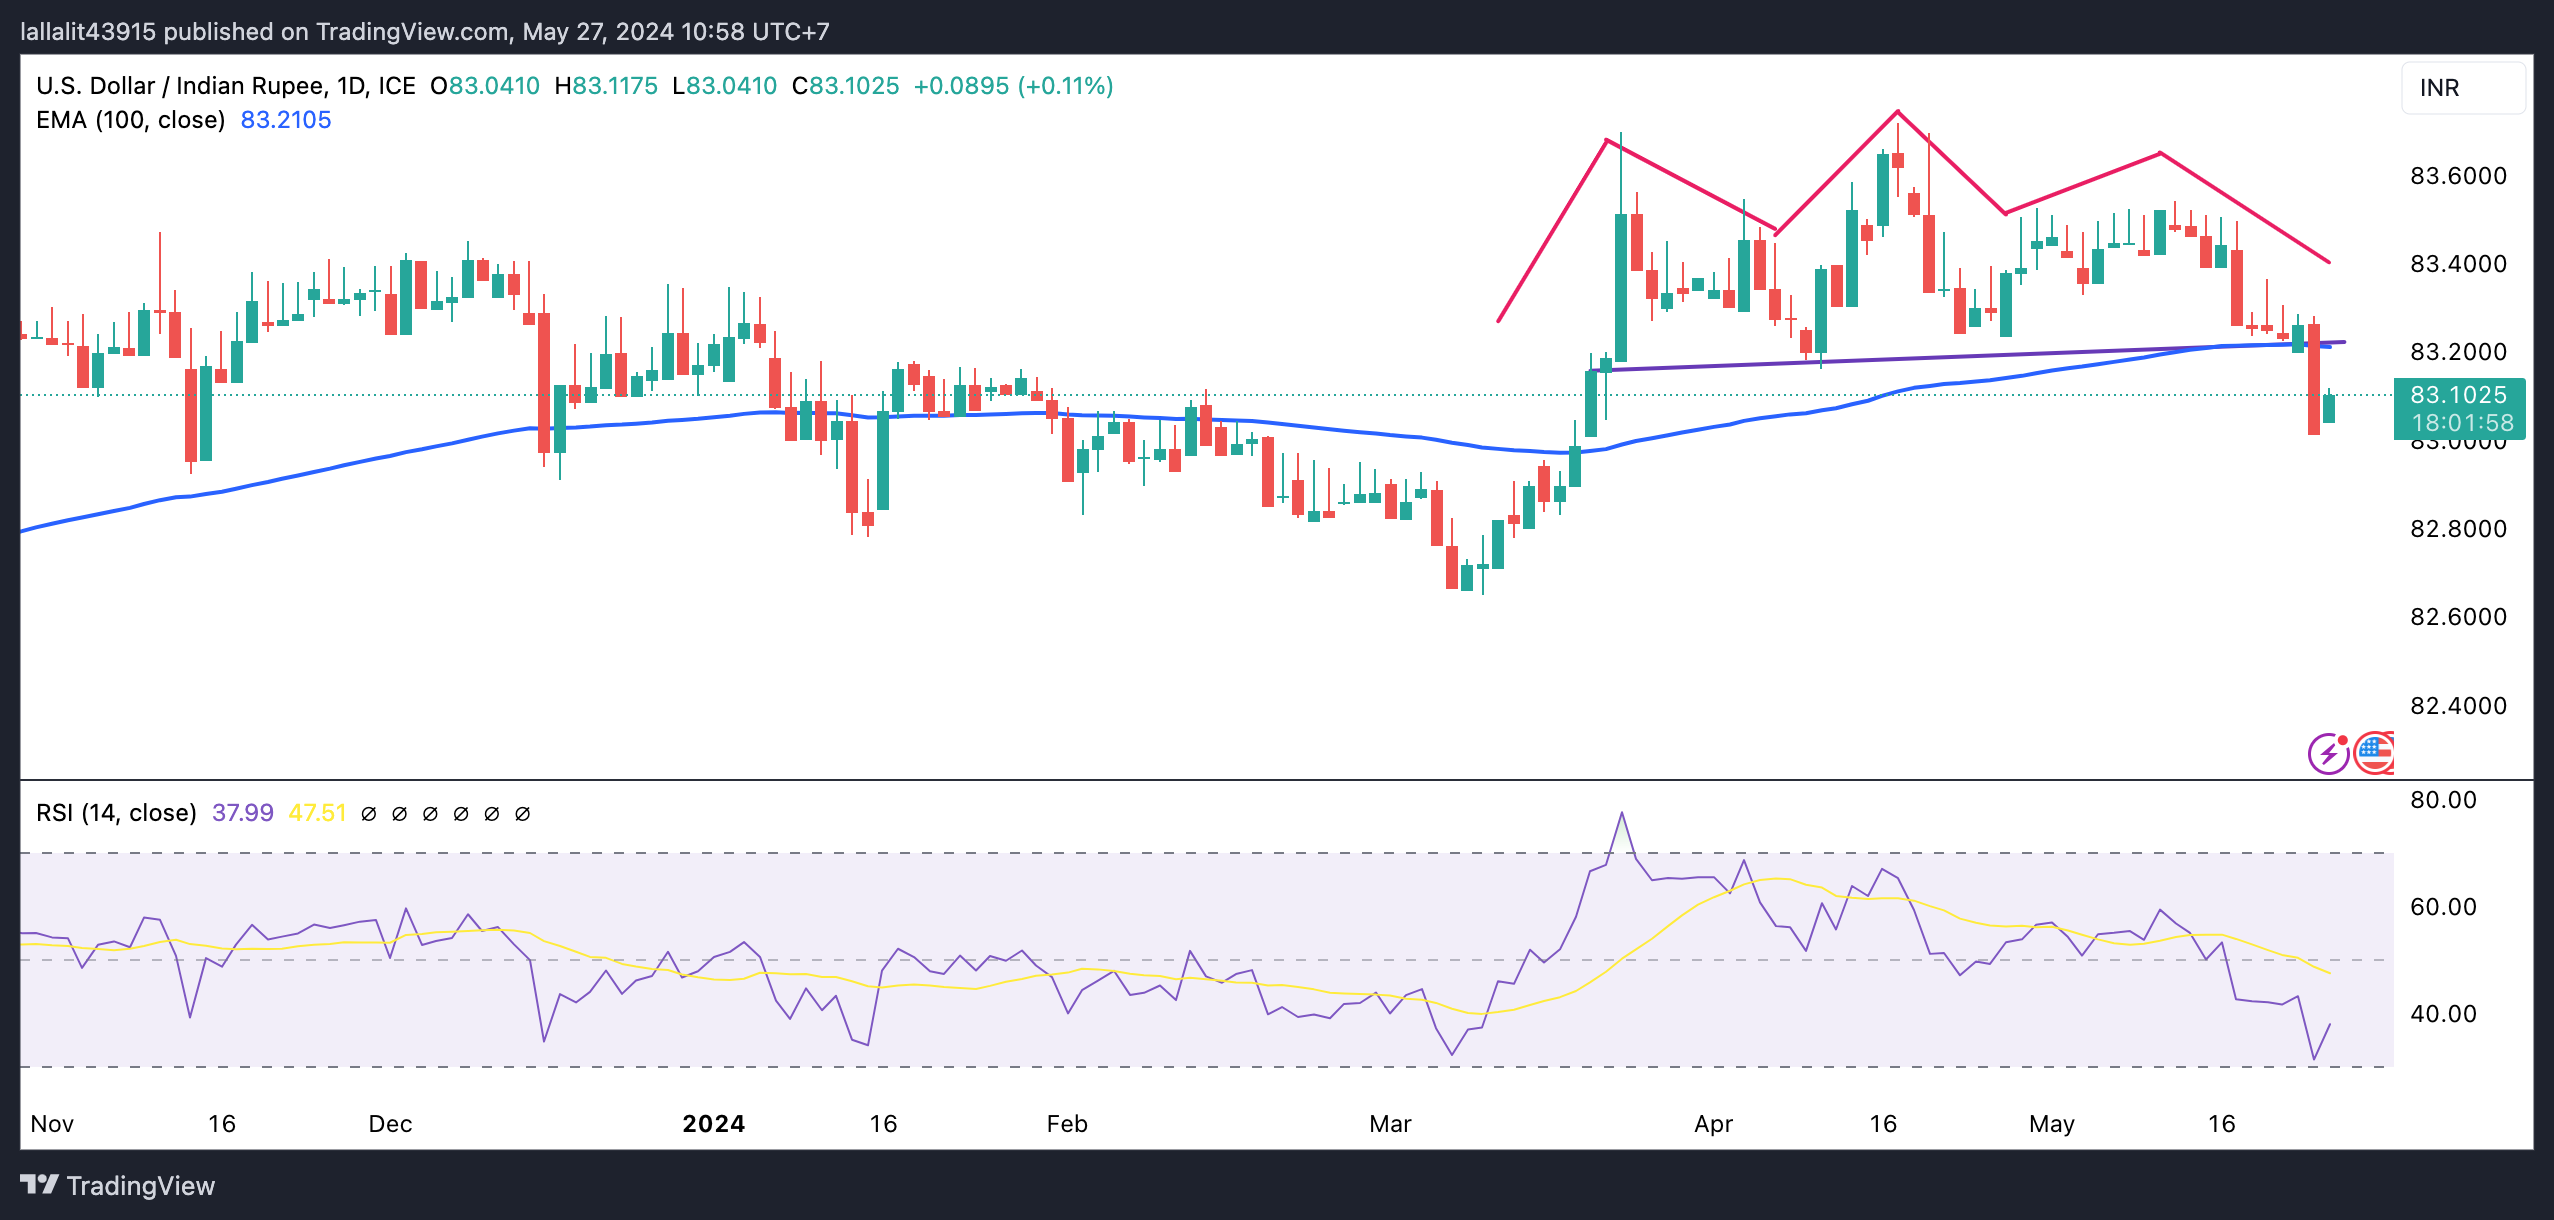
Technical analysis: USD/INR resumes a bearish stance on the daily chart
The support-turned-resistance level and the 100-day EMA at 83.20 will be a potential resistance level for USD/INR. Any follow-through buying above this level will pave the way to a high of May 13 at 83.54, followed by a high of April 17 at 83.72, and finally the 84.00 round level.
On the other hand, a breach of the 83.00 psychological support will expose a low of January 15 at 82.78. Further south, the next contention level is seen near a low of March 11 at 82.65.
US Dollar price in the last 7 days
The table below shows the percentage change of US Dollar (USD) against listed major currencies in the last 7 days. US Dollar was the strongest against the Australian Dollar.
| USD | EUR | GBP | CAD | AUD | JPY | NZD | CHF | |
| USD | 0.22% | -0.30% | 0.41% | 0.93% | 0.69% | 0.12% | 0.67% | |
| EUR | -0.22% | -0.51% | 0.19% | 0.73% | 0.48% | -0.10% | 0.47% | |
| GBP | 0.30% | 0.52% | 0.70% | 1.23% | 1.01% | 0.43% | 0.98% | |
| CAD | -0.41% | -0.22% | -0.73% | 0.50% | 0.29% | -0.29% | 0.27% | |
| AUD | -0.94% | -0.73% | -1.25% | -0.53% | -0.25% | -0.83% | -0.27% | |
| JPY | -0.69% | -0.47% | -1.02% | -0.27% | 0.26% | -0.59% | -0.01% | |
| NZD | -0.12% | 0.10% | -0.42% | 0.29% | 0.82% | 0.57% | 0.58% | |
| CHF | -0.71% | -0.48% | -1.00% | -0.28% | 0.27% | 0.01% | -0.57% |
The heat map shows percentage changes of major currencies against each other. The base currency is picked from the left column, while the quote currency is picked from the top row. For example, if you pick the Euro from the left column and move along the horizontal line to the Japanese Yen, the percentage change displayed in the box will represent EUR (base)/JPY (quote).
GDP FAQs
A country’s Gross Domestic Product (GDP) measures the rate of growth of its economy over a given period of time, usually a quarter. The most reliable figures are those that compare GDP to the previous quarter e.g Q2 of 2023 vs Q1 of 2023, or to the same period in the previous year, e.g Q2 of 2023 vs Q2 of 2022. Annualized quarterly GDP figures extrapolate the growth rate of the quarter as if it were constant for the rest of the year. These can be misleading, however, if temporary shocks impact growth in one quarter but are unlikely to last all year – such as happened in the first quarter of 2020 at the outbreak of the covid pandemic, when growth plummeted.
A higher GDP result is generally positive for a nation’s currency as it reflects a growing economy, which is more likely to produce goods and services that can be exported, as well as attracting higher foreign investment. By the same token, when GDP falls it is usually negative for the currency. When an economy grows people tend to spend more, which leads to inflation. The country’s central bank then has to put up interest rates to combat the inflation with the side effect of attracting more capital inflows from global investors, thus helping the local currency appreciate.
When an economy grows and GDP is rising, people tend to spend more which leads to inflation. The country’s central bank then has to put up interest rates to combat the inflation. Higher interest rates are negative for Gold because they increase the opportunity-cost of holding Gold versus placing the money in a cash deposit account. Therefore, a higher GDP growth rate is usually a bearish factor for Gold price.
Author

Lallalit Srijandorn
FXStreet
Lallalit Srijandorn is a Parisian at heart. She has lived in France since 2019 and now becomes a digital entrepreneur based in Paris and Bangkok.


