- USD/INR falls for the second straight day, as bulls fail to resist above 100-DMA.
- The spot clings to 21-DMA support amid a broad US dollar weakness.
- A pullback in WTI price also helps comfort the INR bulls.
USD/INR remains on the defensive for the second day in a row this Thursday, keeping its range below 74.50.
The pair tracks the US dollar weakness while the Indian rupee cheers a pullback in oil prices from seven-year highs.
The greenback holds the lower ground amid a return of the risk appetite on China’s policy easing, although the March Fed rate hike expectations will continue to support the dollar bulls in the coming days.
At the time of writing, the spot is trying hard to defend the 21-Daily Moving Average (DMA) support, now at 74.41, having failed to find acceptance above the horizontal 100-DMA at 74.59.
The pair’s recovery rally from four-month troughs of 73.73 faltered near 74.70 on Wednesday.
The 14-day Relative Strength Index (RSI) has entered into the negative zone, below the midline, justifying the latest downturn in the price.
If the 21-DMA support gives way, then a test of the horizontal 200-DMA at 74.27 will be inevitable.
A sustained break below the latter could revive the recent bearish momentum towards the multi-month lows.
USD/INR: Daily chart
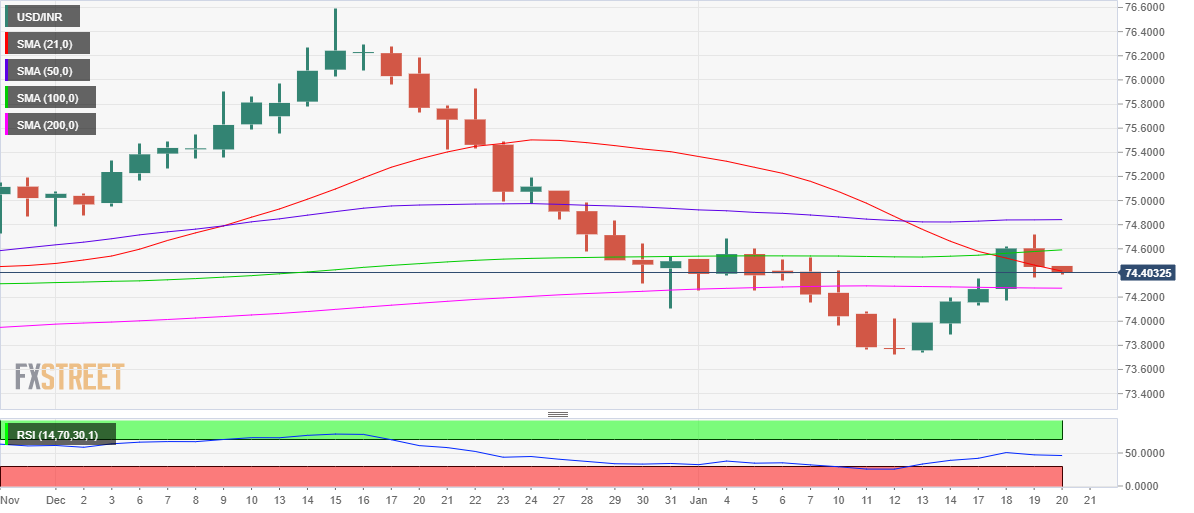
On the flip side, daily closing above 100-DMA will take on USD/INR towards 50-DMA at 74.84.
The level to beat for bulls is envisioned at 75.00, which will guard the further upside.
USD/INR: Additional levels
Information on these pages contains forward-looking statements that involve risks and uncertainties. Markets and instruments profiled on this page are for informational purposes only and should not in any way come across as a recommendation to buy or sell in these assets. You should do your own thorough research before making any investment decisions. FXStreet does not in any way guarantee that this information is free from mistakes, errors, or material misstatements. It also does not guarantee that this information is of a timely nature. Investing in Open Markets involves a great deal of risk, including the loss of all or a portion of your investment, as well as emotional distress. All risks, losses and costs associated with investing, including total loss of principal, are your responsibility. The views and opinions expressed in this article are those of the authors and do not necessarily reflect the official policy or position of FXStreet nor its advertisers. The author will not be held responsible for information that is found at the end of links posted on this page.
If not otherwise explicitly mentioned in the body of the article, at the time of writing, the author has no position in any stock mentioned in this article and no business relationship with any company mentioned. The author has not received compensation for writing this article, other than from FXStreet.
FXStreet and the author do not provide personalized recommendations. The author makes no representations as to the accuracy, completeness, or suitability of this information. FXStreet and the author will not be liable for any errors, omissions or any losses, injuries or damages arising from this information and its display or use. Errors and omissions excepted.
The author and FXStreet are not registered investment advisors and nothing in this article is intended to be investment advice.
Recommended content
Editors’ Picks

EUR/USD consolidates weekly gains above 1.1150
EUR/USD moves up and down in a narrow channel slightly above 1.1150 on Friday. In the absence of high-tier macroeconomic data releases, comments from central bank officials and the risk mood could drive the pair's action heading into the weekend.

GBP/USD stabilizes near 1.3300, looks to post strong weekly gains
GBP/USD trades modestly higher on the day near 1.3300, supported by the upbeat UK Retail Sales data for August. The pair remains on track to end the week, which featured Fed and BoE policy decisions, with strong gains.

Gold extends rally to new record-high above $2,610
Gold (XAU/USD) preserves its bullish momentum and trades at a new all-time high above $2,610 on Friday. Heightened expectations that global central banks will follow the Fed in easing policy and slashing rates lift XAU/USD.

Week ahead – SNB to cut again, RBA to stand pat, PCE inflation also on tap
SNB is expected to ease for third time; might cut by 50bps. RBA to hold rates but could turn less hawkish as CPI falls. After inaugural Fed cut, attention turns to PCE inflation.

Bank of Japan set to keep rates on hold after July’s hike shocked markets
The Bank of Japan is expected to keep its short-term interest rate target between 0.15% and 0.25% on Friday, following the conclusion of its two-day monetary policy review. The decision is set to be announced during the early Asian session.

Moneta Markets review 2024: All you need to know
VERIFIED In this review, the FXStreet team provides an independent and thorough analysis based on direct testing and real experiences with Moneta Markets – an excellent broker for novice to intermediate forex traders who want to broaden their knowledge base.