|

USD/INR Price Analysis: Scales above 82.00 ahead of US Inflation and FOMC minutes

  • USD/INR has continued its auction above 82.00 ahead of US Inflation data.
  • FIIs are turning buyers in the Indian market after months of correction.
  • Oil prices are expected to extend their upside above $81.50 on expectations that the Fed will reach its terminal rate sooner.

The USD/INR pair has delivered a flat opening above 82.00 and is expected to remain volatile as investors are awaiting the release of the United States inflation data and Federal Open Market Committee (FOMC) minutes for fresh impetus.

The US Dollar Index (DXY) has attempted a recovery after a steep correction to near 102.04 as investors are taking caution ahead of inflation data. Meanwhile, S&P500 futures have eased the majority of gains generated in early Asia amid anxiety ahead of the quarterly result season, portraying a caution in an overall upbeat market mood.

The Indian Rupee is also expected to show volatility as the annual result season is at the doorstep. Meanwhile, Foreign Institutional Investors (FIIs) are turning buyers in the Indian market after months of correction.

On the oil front, oil prices are expected to extend their upside above $81.50 on expectations that the Federal Reserve (Fed) will reach its terminal rate sooner.

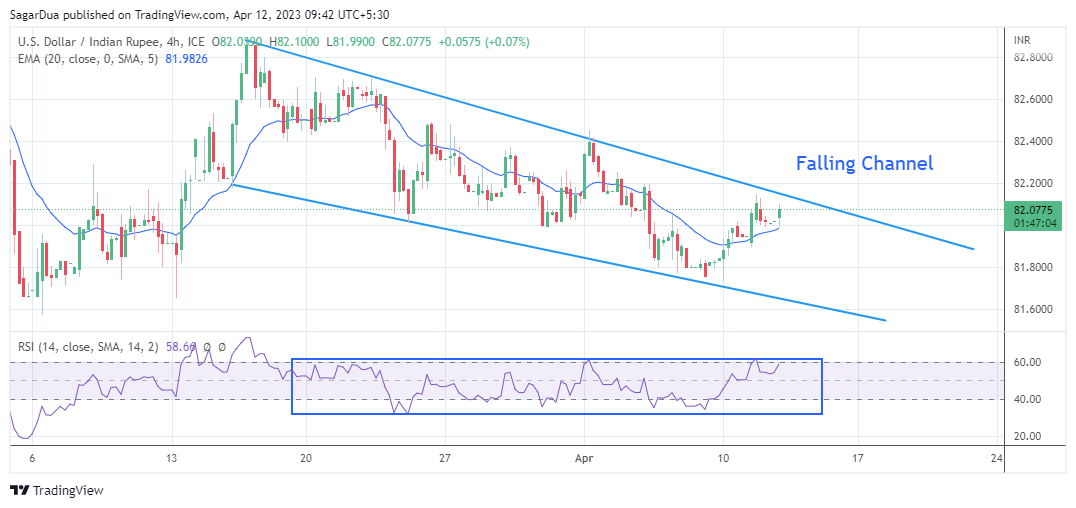
After a firm recovery, USD/INR has reached near the upper portion of the Falling Channel formed on a four-hour scale. Every pullback in the aforementioned chart pattern is considered as buying opportunity for market participants. The 20-period Exponential Moving Average (EMA) at around 82.00 is providing a cushion to the US Dollar bulls.

Also, the Relative Strength Index (RSI) (14) is making efforts in climbing above the 60.00 level. An occurrence of the same will trigger the upside momentum.

Should the asset break above April 05 high at 82.20, US Dollar bulls will push the major toward April 03 high at 82.45 and March 22 high at 82.70.

Alternatively, a downside below April 07 low at 81.75 will drag the asset to March 06 low at 81.57 followed by January 06 low at 81.30.

USD/INR four-hour chart

USD/INR

Overview
Today last price82.0885
Today Daily Change0.0279
Today Daily Change %0.03
Today daily open82.0606
 
Trends
Daily SMA2082.2523
Daily SMA5082.3758
Daily SMA10082.2146
Daily SMA20081.4248
 
Levels
Previous Daily High82.2605
Previous Daily Low81.93
Previous Weekly High82.5092
Previous Weekly Low81.7741
Previous Monthly High83.0315
Previous Monthly Low81.512
Daily Fibonacci 38.2%82.1342
Daily Fibonacci 61.8%82.0563
Daily Pivot Point S181.9069
Daily Pivot Point S281.7532
Daily Pivot Point S381.5764
Daily Pivot Point R182.2374
Daily Pivot Point R282.4142
Daily Pivot Point R382.5679

Author

Sagar Dua

Sagar Dua

FXStreet

Sagar Dua is associated with the financial markets from his college days. Along with pursuing post-graduation in Commerce in 2014, he started his markets training with chart analysis.

More from Sagar Dua
Share:

Editor's Picks

GBP/USD bounces off lows, back above 1.3200

After bottoming out near 1.3160, GBP/USD manages to regain a bit of shine and reclaim the 1.3200 mark and beyond at the end of the week. Stronger-than-expected UK Retail Sales data seem to be helping the British Pound limit its losses, while the chaotic UK political environment keeps the bulls at bay for now.

EUR/USD looks consolidative around 1.1460

EUR/USD stages a modest rebound after slipping to a three-month low below 1.1420 at the end of the week. That said, the pair now looks to consolidate humble gains just above 1.1460 despite growing uncertainty surrounding the next round of US-Iran negotiations, which keeps the US Dollar’s downside contained.

Gold slips back to six-day lows, targets $4,100

Gold retreats for the third consecutive day on Friday, eroding gains seen in the first half of the week and approaching the key $4,100 mark per troy ounce. Indeed, the precious metal continues to face headwinds from the Fed's hawkish stance and renewed uncertainty surrounding the next round of US-Iran negotiations.

Solana extends correction despite ETF inflows, RWA adoption

Solana (SOL) price edges below $70 extending its losses for the fourth straight day this week. The institutional demand for Solana is building, with steady inflows so far this week and Morgan Stanley’s amended S-1 filing for a Solana-focused Exchange-Traded Fund.

The Iran war didn't break the US economy, but what happens next?

Nearly four months after the start of the Iran war, the US economy remains remarkably resilient. While the conflict initially triggered a severe disruption to global energy markets and a sharp rise in Oil prices, recent diplomatic progress between Washington and Tehran has eased concerns about a prolonged supply shock.

Regime change: Inside Kevin Warsh's first move to make the Fed unreadable on purpose

The rate did not move. That was the least interesting thing about Kevin Warsh's first meeting in charge of the Fed. The FOMC held its benchmark at 3.50%-3.75% for the fourth straight meeting, exactly as priced, and then the new chair used his first press conference to dismantle the machinery the market has leaned on for a decade.