|

USD/INR Price Analysis: Recovery of the Indian rupee capped by 73.30

  • The Indian rupee is among the top EM performers on Monday.
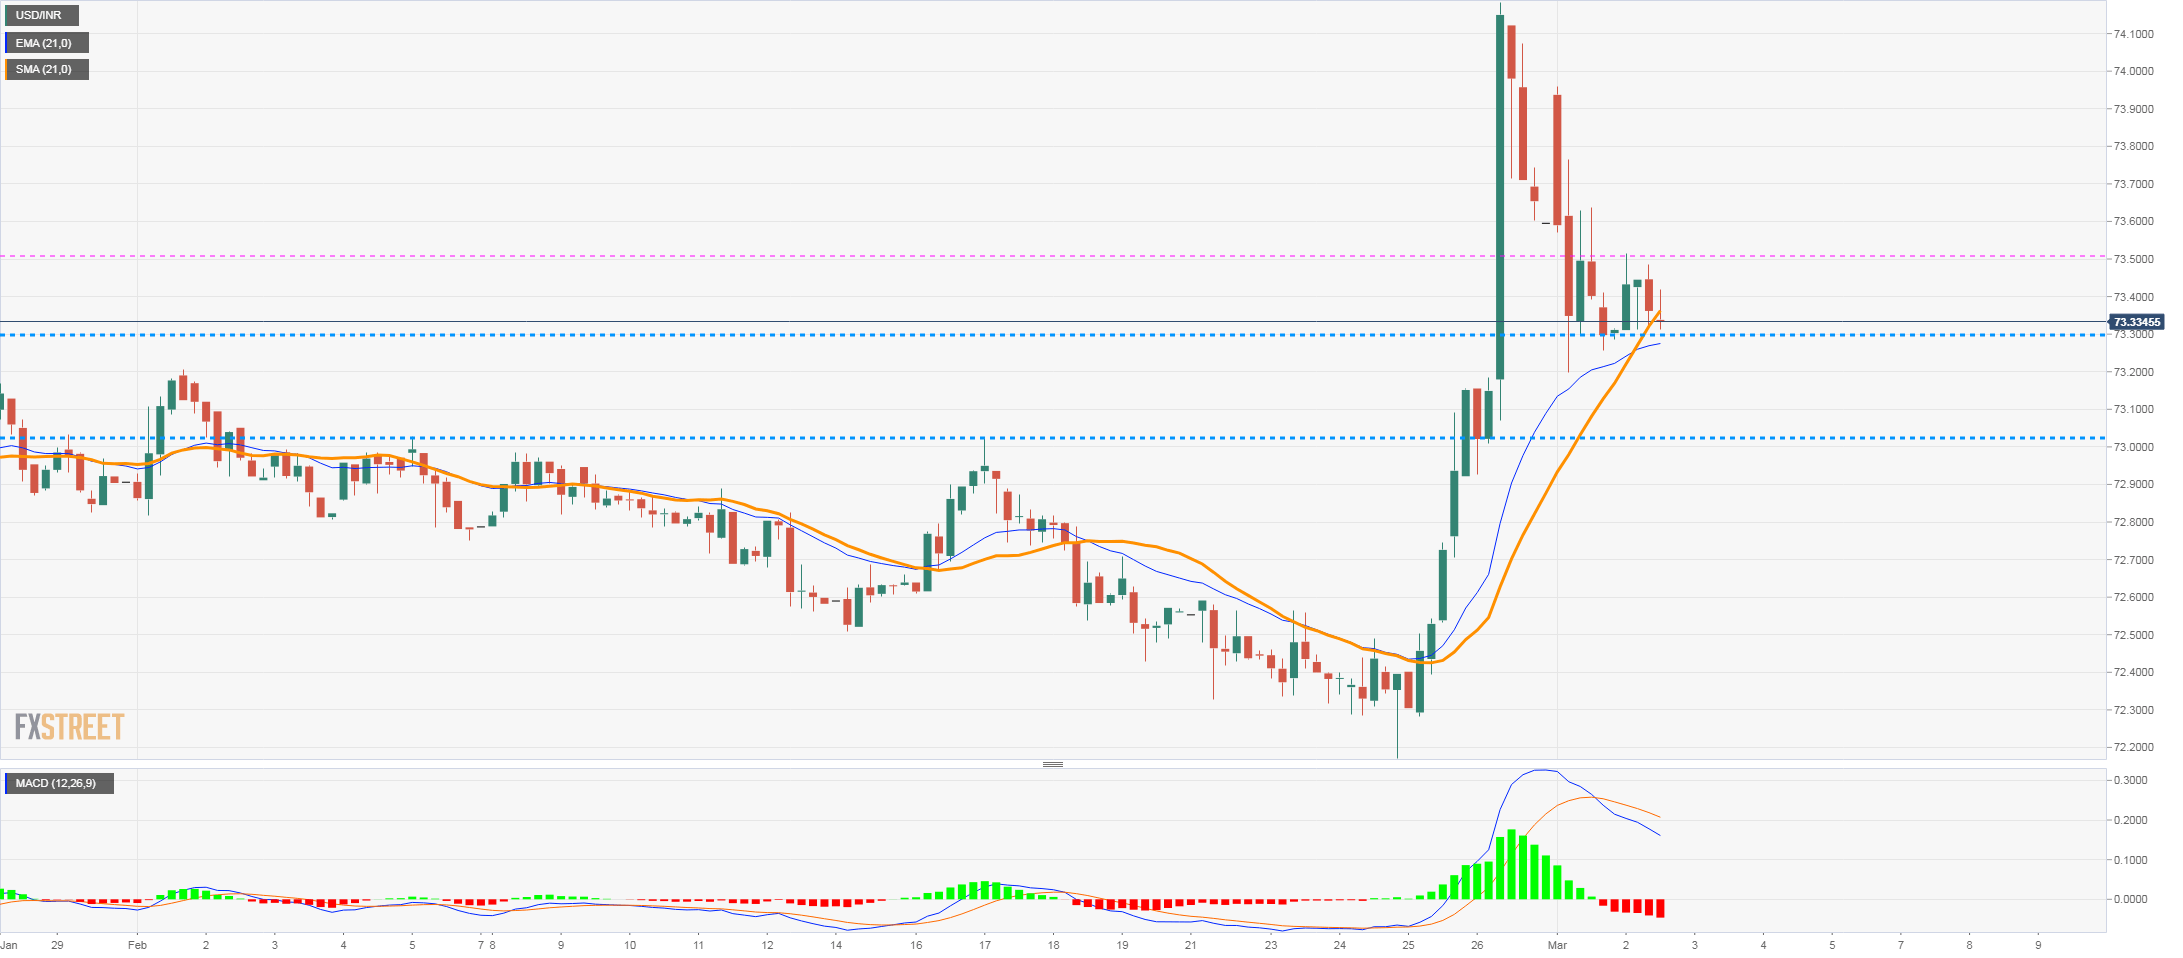
  • USD/INR bearish momentum remains in place, challenges support at 73.30.

The USD/INR is falling on Tuesday on the back of the improvement in risk sentiment. During the last hours, markets across the globe eared losses supporting the demand for riskier assets.

The pair is testing the 73.30 support area and a break lower would likely clear the way to more losses. The next key support is located at the 73.00, a psychological area and also a horizontal support. A daily close below would point to further strengthening of the Indian rupee.

If the USD/INR fails to break 73.30, the US dollar could gain momentum for a rally toward 73.50. The next barrier emerges at 73.90. A daily close above 74.00 would suggest more gains ahead. A deterioration in market sentiment in Wall Street would support another rally to the 74.00 area.

Between the RBI, yields and Wall Street

The pair is moving between global risk flows and expectations about monetary policy in India. Risk appetite should continue to offer support to INR and emerging market currencies.

“Swifter growth (GDP in Q3 FY21 witnessed a mild expansion) and stubborn inflation will prompt the Reserve Bank of India to normalise monetary policy, which it has already begun in parts. In order to assuage markets, we believe the reliance on various tools to drain liquidity will become more important, like raising the reverse repo rate and the SLR. The rupee’s appreciation can be another channel and we think the RBI will ease its interventionas a result”, explained analysts from ANZ Research. They expect USD/INR to end 2021 at 71.00. “We still believe a sharp appreciation is unlikely, given policymakers’ tilt towards self-reliance and a competitive rupee. USD/INR at 70.00 should be the line in the sand.”

USD/INR 4-hour chart

usdinr

USD/INR

Overview
Today last price73.3428
Today Daily Change0.0434
Today Daily Change %0.06
Today daily open73.2994
 
Trends
Daily SMA2072.8015
Daily SMA5073.0527
Daily SMA10073.4872
Daily SMA20074.0527
 
Levels
Previous Daily High73.958
Previous Daily Low73.1975
Previous Weekly High74.1841
Previous Weekly Low72.1719
Previous Monthly High74.1841
Previous Monthly Low72.1719
Daily Fibonacci 38.2%73.488
Daily Fibonacci 61.8%73.6675
Daily Pivot Point S173.0119
Daily Pivot Point S272.7244
Daily Pivot Point S372.2514
Daily Pivot Point R173.7725
Daily Pivot Point R274.2455
Daily Pivot Point R374.533

Author

Matías Salord

Matías started in financial markets in 2008, after graduating in Economics. He was trained in chart analysis and then became an educator. He also studied Journalism. He started writing analyses for specialized websites before joining FXStreet.

More from Matías Salord
Share:

Markets move fast. We move first.

Orange Juice Newsletter brings you expert driven insights - not headlines. Every day on your inbox.

By subscribing you agree to our Terms and conditions.

Editor's Picks

EUR/USD edges above 1.1750 due to ECB-Fed policy divergence

EUR/USD has recovered its recent losses registered in the previous session, trading around 1.1760 during the Asian hours on Friday. Traders will likely observe Germany’s Manufacturing Purchasing Managers’ Index data later in the day.

GBP/USD gathers strength above 1.3450 on Fed rate cut bets, BoE's gradual policy path

The GBP/USD pair gathers strength to around 1.3480 during the early Asian session on Friday. Expectations of the US Federal Reserve rate cuts this year weigh on the US Dollar against the Pound Sterling. Philadelphia Fed President Anna Paulson is set to speak later on the weekend. 

Gold climbs to near $4,350 on Fed rate cut bets, geopolitical risks

Gold price rises to near $4,345 during the early Asian session on Friday. Gold finished 2025 with a significant rally, achieving an annual gain of around 65%, its biggest annual gain since 1979. The rally of the precious metal is bolstered by the prospect of further US interest rate cuts in 2026 and safe-haven flows.

Bitcoin trades in compression as 2026 begins with structure still unresolved

BTC/USD remains locked in a two-way structure, with micro supply-and-demand levels guiding early-year price behaviour.

Economic outlook 2026-2027 in advanced countries: Solidity test

After a year marked by global economic resilience and ending on a note of optimism, 2026 looks promising and could be a year of solid economic performance. In our baseline scenario, we expect most of the supportive factors at work in 2025 to continue to play a role in 2026.

Crypto market outlook for 2026

Year 2025 was volatile, as crypto often is.  Among positive catalysts were favourable regulatory changes in the U.S., rise of Digital Asset Treasuries (DAT), adoption of AI and tokenization of Real-World-Assets (RWA).