USD/INR remains tepid due to expected foreign inflows, awaits US PCE Price Index
- The Indian Rupee gains ground due to expected foreign inflows on bonds joining J.P. Morgan’s Emerging Market Bond Index.
- Indian equity markets appreciate due to the return of foreign institutional investors and growing purchases in index heavyweights.
- US Core PCE to be released on Friday; expected to decrease YoY to 2.6% from the previous 2.8%.

The Indian Rupee (INR) extends its gains due to expected foreign inflows as Indian bonds join the JP Morgan Emerging Market (EM) Bond Index on Friday. Foreign investors have already invested approximately $10 billion into the securities eligible to join JPMorgan’s index, according to Business Standard. Meanwhile, Goldman Sachs anticipates at least $30 billion more in inflows in the coming months as India’s weighting on the index steadily rises to 10%.
Indian Rupee traders would likely observe key economic data on Friday, including the Federal Fiscal Deficit for May and FX Reserves for the week ending June 17.
On the US Dollar’s (USD) front, Core PCE Price Index inflation is projected to decrease YoY to 2.6% from the previous 2.8%. This data is seen as the Federal Reserve's (Fed) preferred inflation gauge.
Daily Digest Market Movers: Indian Rupee offers gains due to risk aversion
- Indian equity markets extend gains due to the return of foreign institutional investors and growing purchases in index heavyweights. Traders maintain an upside momentum for the Indian equity markets, buoyed by optimism about the upcoming union budget for 2024-2025 and solid domestic economic data. The Reserve Bank of India (RBI) expects the economy to grow by 7.2% in FY 2025, further lifting market sentiment.
- Federal Reserve (Fed) Board of Governors member Michelle Bowman noted on Thursday that she is still not ready to support a central bank rate cut with inflation pressures still elevated. Bowman said, adding “We are still not yet at the point where it is appropriate to lower the policy rate, and I continue to see a number of upside risks to inflation,” per Reuters.
- US Gross Domestic Product Annualized expanded by 1.4% in Q1, slightly higher than the previous reading of 1.3%, but continuing to point to the lowest growth since the contractions in the first half of 2022.
- US Initial Jobless Claims showed on Thursday that the number of people claiming unemployment benefits fell to 233,000 in the week ending June 21, below market expectations of 236,000. The claim count fell for a second consecutive week since hitting the 10-month high of 243,000 earlier in June.
- The first US presidential debate between President Joe Biden and Republican Presidential Nominee Donald Trump began on CNN News. Biden acknowledged that “inflation had driven prices substantially higher than at the start of his term but said he deserves credit for putting 'things back together again' following the coronavirus pandemic.” In response, Trump condemned elevated inflation levels. He suggested that tariffs would decrease deficits and urged scrutiny of countries like China, per Reuters.
- The S&P Global Ratings retained its growth forecast for India at 6.8% for FY25, citing high interest rates and government spending boosting demand in the non-agricultural sectors.
- On Tuesday, RBI Governor Shaktikanta Das said that India is on the verge of a major structural shift in its growth trajectory, moving towards sustained 8% GDP growth. Das attributes this growth to several key drivers, including structural reforms such as the Goods and Services Tax (GST), reported by The Economic Times.
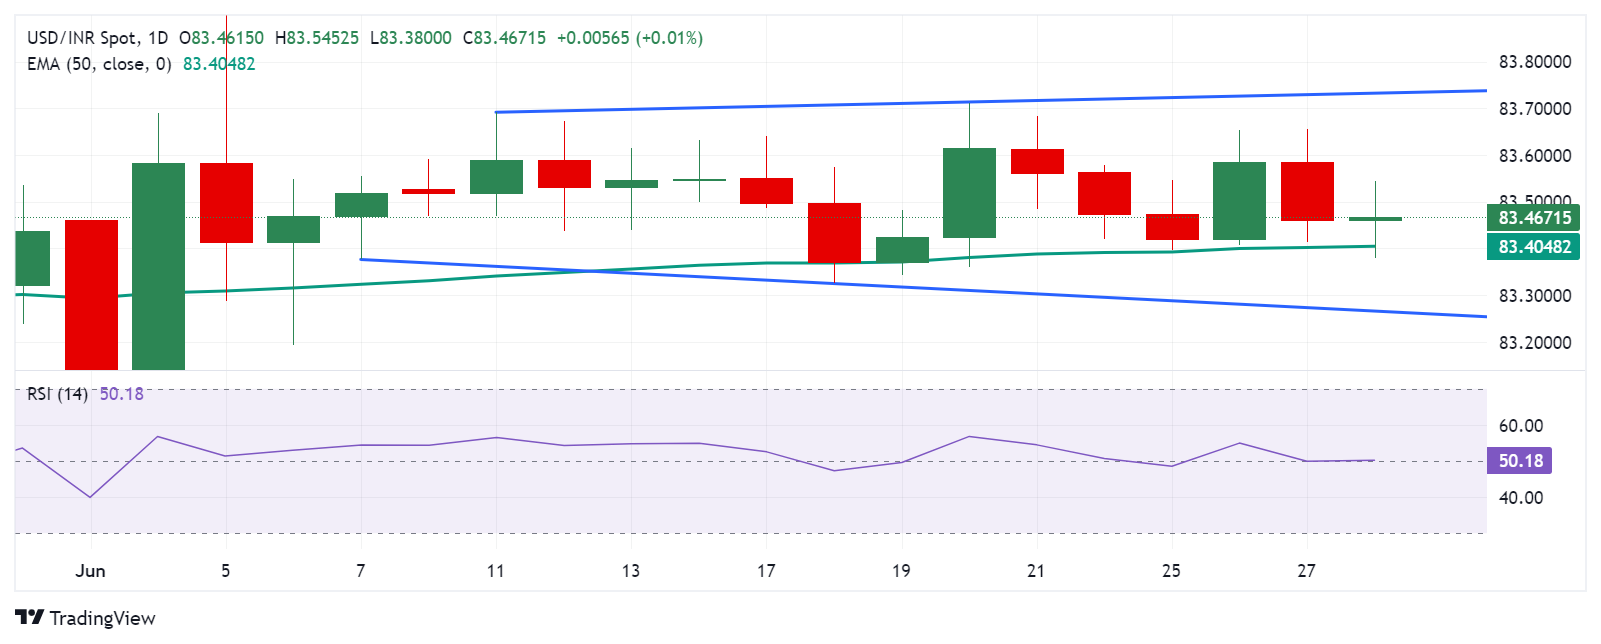
Technical analysis: USD/INR falls below 83.50
The USD/INR trades around 83.40 on Friday. The analysis of the daily chart shows a broadening pattern, suggesting a potential correction before a downward movement. The 14-day Relative Strength Index (RSI) is below the 50 level, indicating a bearish bias.
The USD/INR pair tests the immediate support at the 50-day Exponential Moving Average (EMA) of 83.40. A break below this level could potentially strengthen the bearish bias, which could lead the pair toward the lower boundary of the broadening pattern, around the 83.30 level.
Resistance on the upside is anticipated near the upper boundary of the broadening formation, around 83.70, followed by the psychological level of 84.00.
USD/INR: Daily Chart
US Dollar PRICE Today
The table below shows the percentage change of US Dollar (USD) against listed major currencies today. US Dollar was the weakest against the Indian Rupee.
| USD | EUR | GBP | JPY | CAD | AUD | NZD | INR | |
|---|---|---|---|---|---|---|---|---|
| USD | 0.07% | 0.00% | 0.00% | 0.06% | 0.03% | 0.17% | -0.09% | |
| EUR | -0.07% | -0.07% | -0.07% | 0.01% | -0.04% | 0.09% | -0.17% | |
| GBP | -0.00% | 0.07% | -0.02% | 0.04% | 0.02% | 0.16% | -0.12% | |
| JPY | 0.00% | 0.07% | 0.02% | 0.03% | 0.03% | 0.15% | -0.08% | |
| CAD | -0.06% | -0.01% | -0.04% | -0.03% | -0.03% | 0.11% | -0.13% | |
| AUD | -0.03% | 0.04% | -0.02% | -0.03% | 0.03% | 0.13% | -0.12% | |
| NZD | -0.17% | -0.09% | -0.16% | -0.15% | -0.11% | -0.13% | -0.27% | |
| INR | 0.09% | 0.17% | 0.12% | 0.08% | 0.13% | 0.12% | 0.27% |
The heat map shows percentage changes of major currencies against each other. The base currency is picked from the left column, while the quote currency is picked from the top row. For example, if you pick the US Dollar from the left column and move along the horizontal line to the Japanese Yen, the percentage change displayed in the box will represent USD (base)/JPY (quote).
Economic Indicator
Core Personal Consumption Expenditures - Price Index (MoM)
The Core Personal Consumption Expenditures (PCE), released by the US Bureau of Economic Analysis on a monthly basis, measures the changes in the prices of goods and services purchased by consumers in the United States (US). The PCE Price Index is also the Federal Reserve’s (Fed) preferred gauge of inflation. The MoM figure compares the prices of goods in the reference month to the previous month.The core reading excludes the so-called more volatile food and energy components to give a more accurate measurement of price pressures. Generally, a high reading is bullish for the US Dollar (USD), while a low reading is bearish.
Read more.Next release: Fri Jun 28, 2024 12:30
Frequency: Monthly
Consensus: 0.1%
Previous: 0.2%
Source: US Bureau of Economic Analysis
After publishing the GDP report, the US Bureau of Economic Analysis releases the Personal Consumption Expenditures (PCE) Price Index data alongside the monthly changes in Personal Spending and Personal Income. FOMC policymakers use the annual Core PCE Price Index, which excludes volatile food and energy prices, as their primary gauge of inflation. A stronger-than-expected reading could help the USD outperform its rivals as it would hint at a possible hawkish shift in the Fed’s forward guidance and vice versa.
Author

Akhtar Faruqui
FXStreet
Akhtar Faruqui is a Forex Analyst based in New Delhi, India. With a keen eye for market trends and a passion for dissecting complex financial dynamics, he is dedicated to delivering accurate and insightful Forex news and analysis.


