USD/IDR Technical Analysis: Forms rising wedge below 200-DMA
- USD/IDR stays firm around the six-week top.
- A rising trend line since late-October repeatedly limits the pair’s upside.
- Confirmation of the bearish chart pattern could recall July lows.
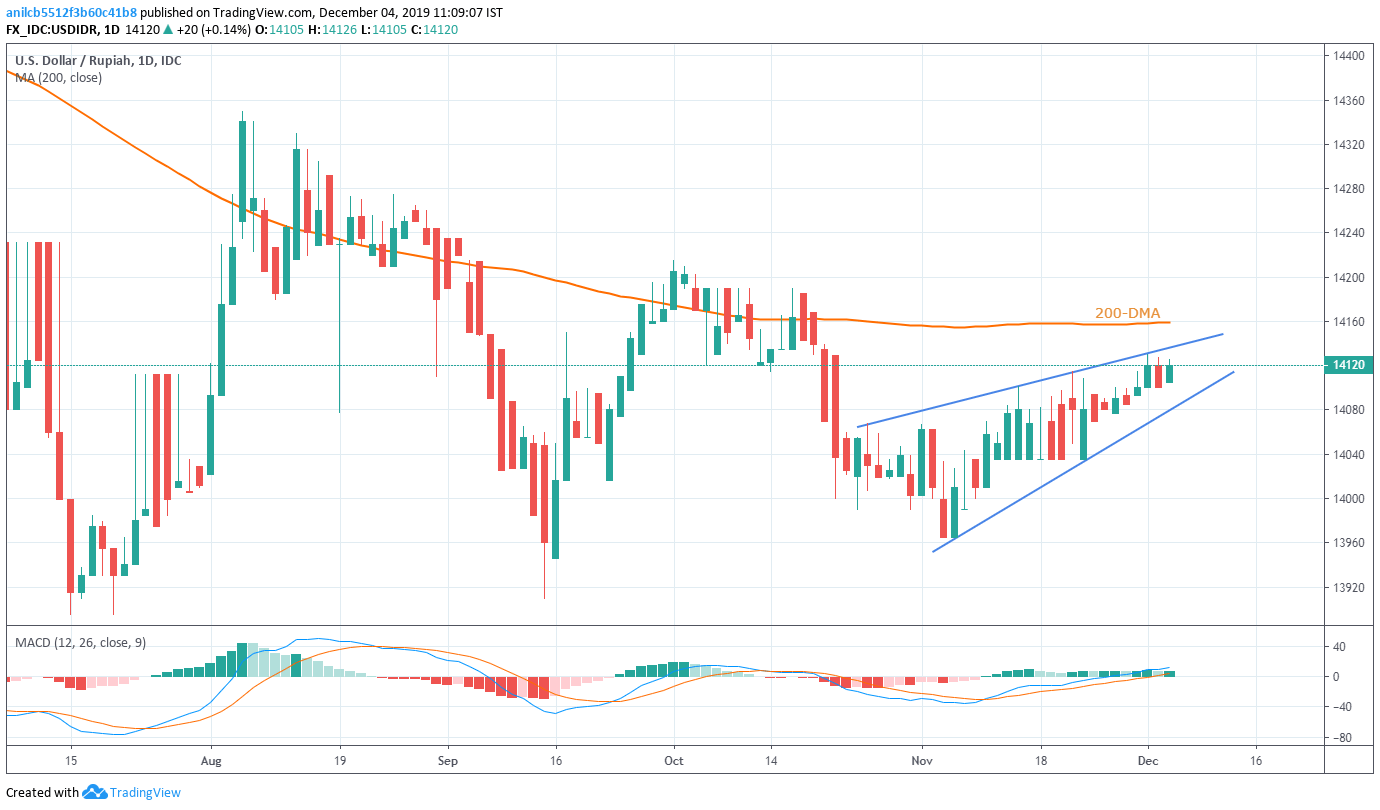
USD/IDR takes the bids to 14,120 during the pre-European session on Wednesday. The pair stays on the front foot around the highest levels since October 22 but registers repeated failures to cross near-term ascending resistance line. While looking at the rising support line from November 06, in conjunction with the immediate trend line resistance, the pair forms a bearish technical chart pattern.
In order to confirm the bearish formation, the pair needs to slip beneath the support line, at 14,080, which in turn could drag the quote to July lows near 13,900. However, mid-November lows surrounding 14,030 and 14,000 round-figure could offer intermediate halts during the quote’s slump.
Meanwhile, pair’s run-up beyond 14,140 resistance line can take aim at 200-Day Simple Moving Average (DMA) level near 14,160.
In a case where Bulls keep the rein past-14,160, October month high near 14,215 can become their favorite.
USD/IDR daily chart
Trend: Pullback expected
Author

Anil Panchal
FXStreet
Anil Panchal has nearly 15 years of experience in tracking financial markets. With a keen interest in macroeconomics, Anil aptly tracks global news/updates and stays well-informed about the global financial moves and their implications.


