USD/IDR technical analysis: 14,335/45 becomes the key resistance-area
- Multiple key indicators highlight 14,335/45 as a tough nut to crack for buyers.
- Break of channel support can recall April month levels.

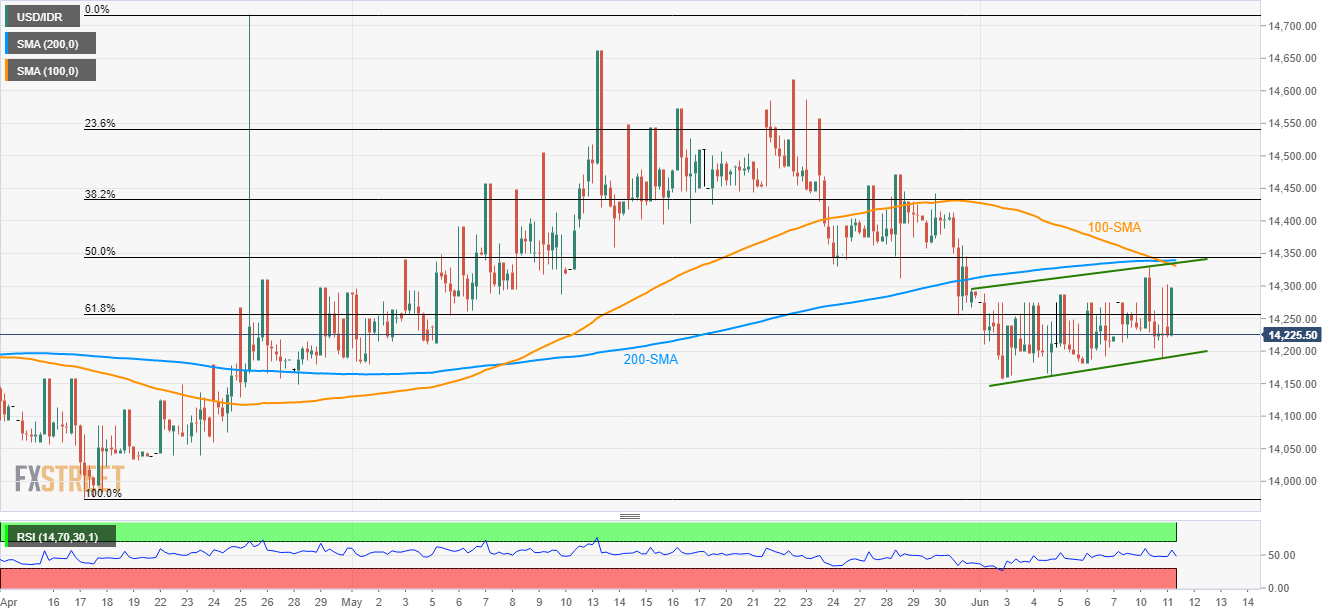
USD/IDR is on the bids near 14,298 while heading towards a much important resistance confluence during early Wednesday.
Not only short-term channel-resistance and 50% Fibonacci retracement of April month rise but 100 and 200 bar moving averages (SMAs) on 4-hour chart also highlights the importance of 14,335/45 area for buyers to watch.
Should prices rally beyond 14,345, May 28 high around 14,470 and 14,618 figure comprising May 23 top could flash next on the bulls’ radar.
Additionally, pair’s extended north-run past-14,618 may question 14,662 and 14,720 during further rise.
On the contrary, 14,220 may act as immediate support ahead of highlighting the channel’s lower line near 14,191.
If the quote slips beneath 14,191, 14,100 and April month bottom around 14,000 might come back to the chart.
USD/IDR 4-Hour chart
Trend: Pullback expected
Author

Anil Panchal
FXStreet
Anil Panchal has nearly 15 years of experience in tracking financial markets. With a keen interest in macroeconomics, Anil aptly tracks global news/updates and stays well-informed about the global financial moves and their implications.


