|

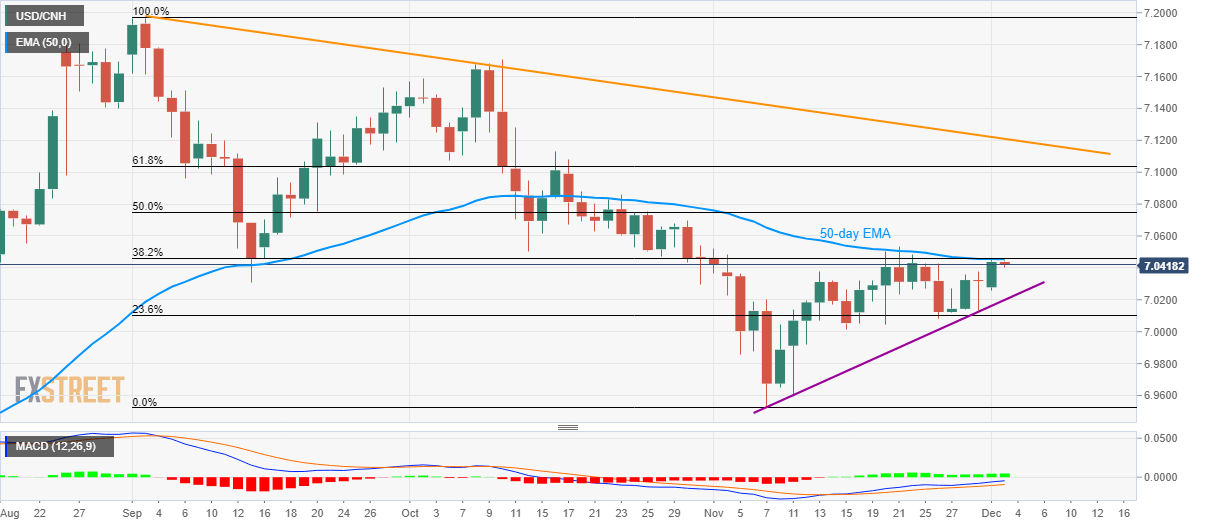
USD/CNH Technical Analysis: Steps back from 7.0456/55 resistance confluence

  • USD/CNH nears 50-day EMA, 38.2% Fibonacci retracement.
  • A monthly trend line limits the immediate downside.
  • 50% of Fibonacci retracement will be in focus after the breakout.

Failure to rise past 50-day Exponential Moving Average (EMA) and 38.2% Fibonacci retracement of September-November fall drag the USD/CNH pair to 7.0427 during early Tuesday.

As a result, prices can revisit an upward sloping trend line since November 07, at 7.0200. However, pair’s further declines make it vulnerable to test November 05 low of 6.9860 and the previous month’s low around 6.9525.

Meanwhile, 12-bar Moving Average Convergence and Divergence (MACD) favors the pair’s run-up beyond 7.0455/56 resistance confluence.

In doing so, a 50% Fibonacci retracement level of 7.0750 and mid-October high near 7.1130 will be on the Bull’s radar.

Though, a descending trend line since early September, at 7.1210 could challenge buyers afterward.

USD/CNH daily chart

Trend: Pullback expected

Additional important levels

Overview
Today last price7.0419
Today Daily Change-0.0018
Today Daily Change %-0.03%
Today daily open7.0437
 
Trends
Daily SMA207.0194
Daily SMA507.0645
Daily SMA1007.0546
Daily SMA2006.9321
 
Levels
Previous Daily High7.0456
Previous Daily Low7.0261
Previous Weekly High7.0429
Previous Weekly Low7.0083
Previous Monthly High7.0536
Previous Monthly Low6.9524
Daily Fibonacci 38.2%7.0382
Daily Fibonacci 61.8%7.0335
Daily Pivot Point S17.0313
Daily Pivot Point S27.019
Daily Pivot Point S37.0118
Daily Pivot Point R17.0508
Daily Pivot Point R27.058
Daily Pivot Point R37.0703

Author

Anil Panchal

Anil Panchal

FXStreet

Anil Panchal has nearly 15 years of experience in tracking financial markets. With a keen interest in macroeconomics, Anil aptly tracks global news/updates and stays well-informed about the global financial moves and their implications.

More from Anil Panchal
Share:

Editor's Picks

EUR/USD treads water around 1.1900

EUR/USD edges a tad lower around the 1.1900 area, coming under mild pressure despite the US Dollar keeps the offered stance on turnaround Tuesday. On the US data front, December Retail Sales fell short of expectations, while the ADP four week average printed at 6.5K.

GBP/USD looks weak near 1.3670

GBP/USD trades on the back foot around the 1.3670 region on Tuesday. Cable’s modest retracement also comes in tandem with the decent decline in the Greenback. Moving forward, the US NFP and CPI data in combination with key UK releases should kee the quid under scrutiny in the next few days.

Gold flirts with daily lows near $5,000

Gold comes under marked selling pressure on Tuesday, giving back part of its recent two day advance and threatening to challenge the key $5,000 mark per troy ounce. The yellow metal’s correction follows a better tone in the risk complex, a lower Greenback and shrinking US Treasuty yields.

AI Crypto Update: BankrCoin, Pippin surge as sector market cap steadies above $12B

The Artificial Intelligence (AI) segment is largely on the back foot with major coins such as Bittensor (TAO) and Internet Computer (ICP) extending losses amid a sticky risk-off sentiment.

Dollar drops and stocks rally: The week of reckoning for US economic data

Following a sizeable move lower in US technology Stocks last week, we have witnessed a meaningful recovery unfold. The USD Index is in a concerning position; the monthly price continues to hold the south channel support.

XRP holds $1.40 amid ETF inflows and stable derivatives market

Ripple trades under pressure, with immediate support at $1.40 holding at the time of writing on Tuesday. A recovery attempt from last week’s sell-off to $1.12 stalled at $1.54 on Friday, leading to limited price action between the current support and the resistance.