USD/CNH Price Analysis: Mildly offered between two-month-old resistance and 200-DMA


  • USD/CNH holds lower ground, drops the most in a week.
  • Bullish MACD, sustained trading above 200-DMA challenge bears.
  • PBOC moves, Evergande headlines favored sellers ahead of Fed.

USD/CNH battles key support to extend the pullback from the monthly top, down 0.11% intraday around $6.4750 ahead of Wednesday’s European session.

In doing so, the offshore Chinese currency (CNH) pair struggles to portray the optimism surrounding Evergande and the People’s Bank of China (PBOC) amid pre-Fed caution.

Read: AUD/USD snaps four-day downtrend near 0.7250 on PBOC news, focus on Evergrande, Fed

Technically, the quote remains pressured between a downward sloping trend line from late July and 200-DMA, respectively around $6.4875 and $6.4730.

Even as 23.6% Fibonacci retracement of May-July upside adds strength to the upside hurdle, USD/CNH failures to break the 200-DMA level of $6.4730 joins bullish MACD signals to keep buyers hopeful.

However, a clear upside break of $6.4875 becomes necessary to witness the advances targeting August month’s top near $6.5100.

While the $6.5000 round figure may offer an intermediate halt during the anticipated upside, the yearly peak marked in July around $6.5285 will lure the pair buyers afterward.

Alternatively, 38.2% and 50% Fibonacci retracement levels, respectively around $6.4600 and $6.4400, will be on the USD/CNH bear’s radar on the break of $6.4875 support.

In a case where the quote remains heavy past $6.4400, the monthly bottom near $6.4250-45 will be in focus.

USD/CNH: Daily chart
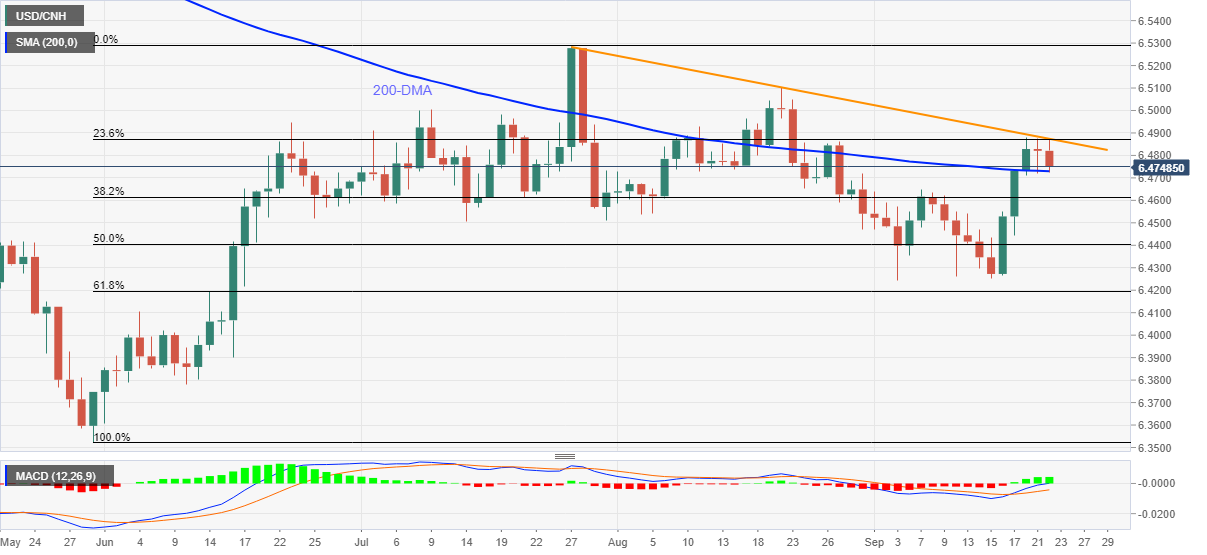
Trend: Bullish

Additional important levels

Overview
Today last price 6.4748
Today Daily Change -0.0072
Today Daily Change % -0.11%
Today daily open 6.482
 
Trends
Daily SMA20 6.4569
Daily SMA50 6.4698
Daily SMA100 6.4526
Daily SMA200 6.4731
 
Levels
Previous Daily High 6.4878
Previous Daily Low 6.472
Previous Weekly High 6.4738
Previous Weekly Low 6.425
Previous Monthly High 6.5102
Previous Monthly Low 6.4473
Daily Fibonacci 38.2% 6.478
Daily Fibonacci 61.8% 6.4818
Daily Pivot Point S1 6.4735
Daily Pivot Point S2 6.4649
Daily Pivot Point S3 6.4578
Daily Pivot Point R1 6.4892
Daily Pivot Point R2 6.4963
Daily Pivot Point R3 6.5049


Share: Feed news

Information on these pages contains forward-looking statements that involve risks and uncertainties. Markets and instruments profiled on this page are for informational purposes only and should not in any way come across as a recommendation to buy or sell in these assets. You should do your own thorough research before making any investment decisions. FXStreet does not in any way guarantee that this information is free from mistakes, errors, or material misstatements. It also does not guarantee that this information is of a timely nature. Investing in Open Markets involves a great deal of risk, including the loss of all or a portion of your investment, as well as emotional distress. All risks, losses and costs associated with investing, including total loss of principal, are your responsibility. The views and opinions expressed in this article are those of the authors and do not necessarily reflect the official policy or position of FXStreet nor its advertisers. The author will not be held responsible for information that is found at the end of links posted on this page.

If not otherwise explicitly mentioned in the body of the article, at the time of writing, the author has no position in any stock mentioned in this article and no business relationship with any company mentioned. The author has not received compensation for writing this article, other than from FXStreet.

FXStreet and the author do not provide personalized recommendations. The author makes no representations as to the accuracy, completeness, or suitability of this information. FXStreet and the author will not be liable for any errors, omissions or any losses, injuries or damages arising from this information and its display or use. Errors and omissions excepted.

The author and FXStreet are not registered investment advisors and nothing in this article is intended to be investment advice.

Recommended content


Recommended content

Editors’ Picks

EUR/USD clings to gains above 1.0750 after US data

EUR/USD clings to gains above 1.0750 after US data

EUR/USD manages to hold in positive territory above 1.0750 despite retreating from the fresh multi-week high it set above 1.0800 earlier in the day. The US Dollar struggles to find demand following the weaker-than-expected NFP data.

EUR/USD News

GBP/USD declines below 1.2550 following NFP-inspired upsurge

GBP/USD declines below 1.2550 following NFP-inspired upsurge

GBP/USD struggles to preserve its bullish momentum and trades below 1.2550 in the American session. Earlier in the day, the disappointing April jobs report from the US triggered a USD selloff and allowed the pair to reach multi-week highs above 1.2600.

GBP/USD News

Gold struggles to hold above $2,300 despite falling US yields

Gold struggles to hold above $2,300 despite falling US yields

Gold stays on the back foot below $2,300 in the American session on Friday. The benchmark 10-year US Treasury bond yield stays in negative territory below 4.6% after weak US data but the improving risk mood doesn't allow XAU/USD to gain traction.

Gold News

Bitcoin Weekly Forecast: Should you buy BTC here? Premium

Bitcoin Weekly Forecast: Should you buy BTC here?

Bitcoin (BTC) price shows signs of a potential reversal but lacks confirmation, which has divided the investor community into two – those who are buying the dips and those who are expecting a further correction.

Read more

Week ahead – BoE and RBA decisions headline a calm week

Week ahead – BoE and RBA decisions headline a calm week

Bank of England meets on Thursday, unlikely to signal rate cuts. Reserve Bank of Australia could maintain a higher-for-longer stance. Elsewhere, Bank of Japan releases summary of opinions.

Read more

Forex MAJORS

Cryptocurrencies

Signatures