|

USD/CHF Price Analysis: Trades sideways above 0.8800, FOMC minutes in focus

  • USD/CHF consolidates in a tight range above 0.8800 as the focus remains on FOMC minutes.
  • The SNB may lead the rate-cut cycle as inflation has been under 2% consecutively for the last eight months.
  • Uncertainty ahead of FOMC minutes brings some strength to the US Dollar Index.

The USD/CHF pair oscillates in a narrow range slightly above the round-level support of 0.8800 in the London session on Wednesday. The Swiss Franc asset struggles for a direction as investors await the release of the Federal Open Market Committee (FOMC) minutes, which are scheduled at 19:00 GMT.

The FOMC minutes for the January policy meeting will provide more insights about the timing of long-awaited rate cuts. More clarity of rate-cut timing would improve the appeal for risk-sensitive assets.

Meanwhile, the US Dollar Index (DXY) has delivered a solid recovery move after refreshing its weekly low near 103.80. 10-year US Treasury yields that determine market expectations for interest rates have rebounded to 4.28%.

The Swiss Franc is broadly downbeat as the Swiss National Bank (SNB) appears to lead the rate-cut cycle due to easing price pressures. The annual inflation rate in the Swiss economy has remained below 2% for the last eight months, indicating the achievement of price stability.

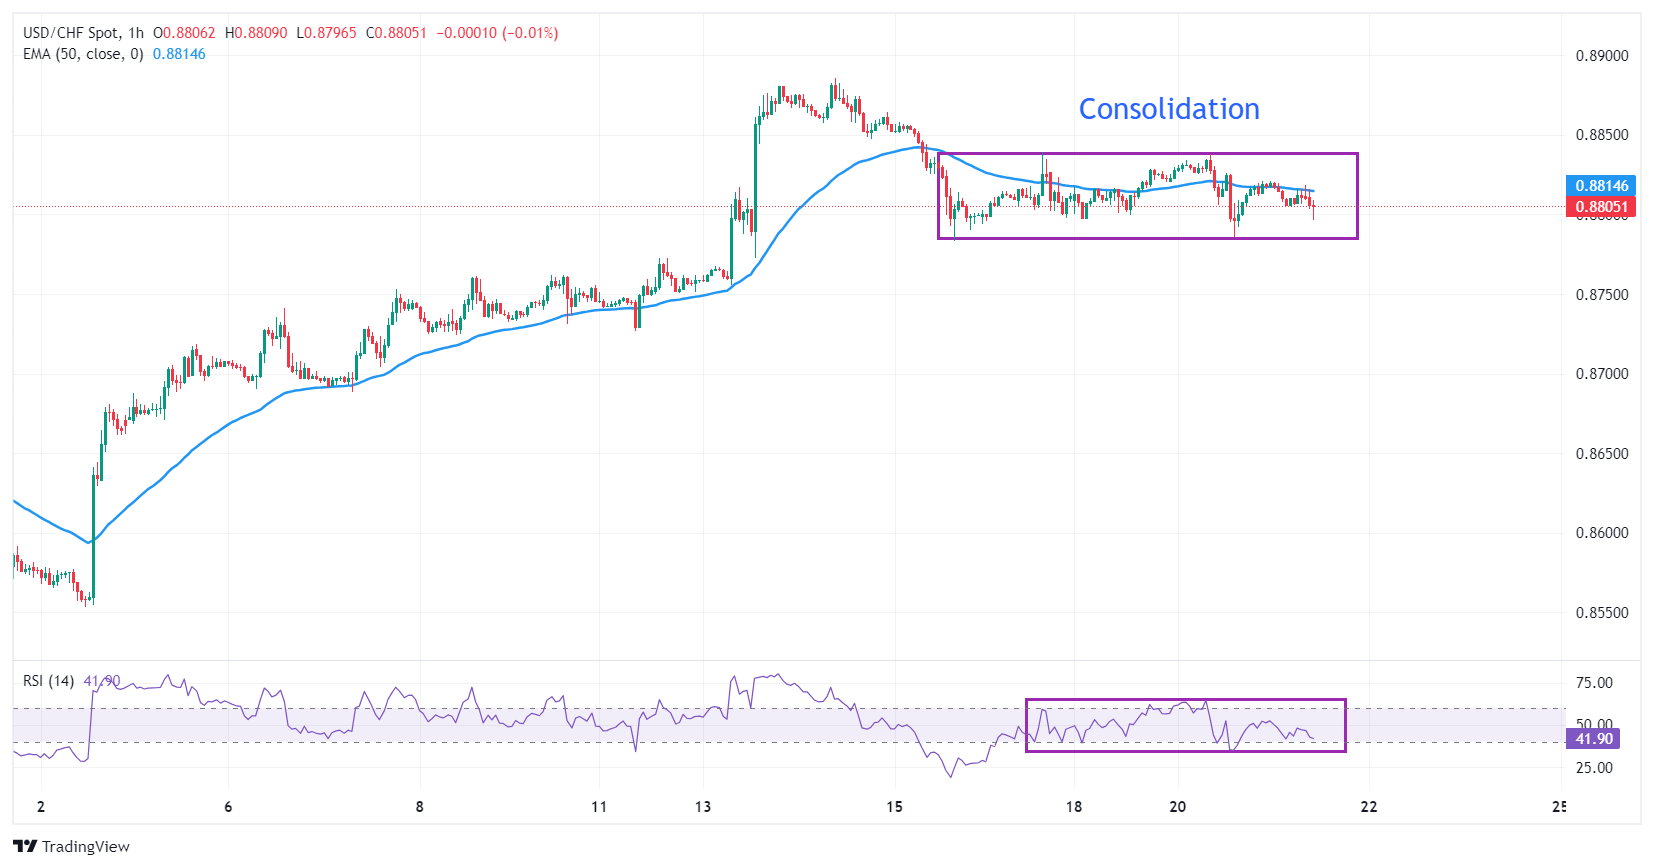
USD/CHF trades sideways in a narrow range of 0.8795-0.8838 on an hourly scale. A sideways trend indicates a volatility contraction, followed by a decisive move in either direction. The 50-period Exponential Moving Average (EMA) near 0.8815 remains sticky to the Swiss Franc asset, indicating indecisiveness among market participants.

The 14-period Relative Strength Index (RSI) oscillates in the 40.00-60.00 range, which indicates that investors await a fresh economic trigger.

Fresh upside would emerge if the asset breaks above the three-month high of around 0.8886, which would unlock upside towards the September 20 low at 0.8932 and the November 8 low at 0.8976.

On the contrary, a breakdown below February 15 low at 0.8783 would expose the asset to February 13 low at 0.8746, followed by the round-level support of 0.8700.

USD/CHF hourly chart

USD/CHF

Overview
Today last price0.8805
Today Daily Change-0.0009
Today Daily Change %-0.10
Today daily open0.8814
 
Trends
Daily SMA200.872
Daily SMA500.8629
Daily SMA1000.8779
Daily SMA2000.884
 
Levels
Previous Daily High0.8838
Previous Daily Low0.8786
Previous Weekly High0.8886
Previous Weekly Low0.8727
Previous Monthly High0.8728
Previous Monthly Low0.8399
Daily Fibonacci 38.2%0.8806
Daily Fibonacci 61.8%0.8818
Daily Pivot Point S10.8787
Daily Pivot Point S20.876
Daily Pivot Point S30.8735
Daily Pivot Point R10.8839
Daily Pivot Point R20.8865
Daily Pivot Point R30.8891

Author

Sagar Dua

Sagar Dua

FXStreet

Sagar Dua is associated with the financial markets from his college days. Along with pursuing post-graduation in Commerce in 2014, he started his markets training with chart analysis.

More from Sagar Dua
Share:

Editor's Picks

EUR/USD slumps below 1.1750 as USD benefits from risk-aversion

EUR/USD comes under renewed bearish pressure in the European session and trades below 1.1750 following a recovery attempt earlier in the day. The US Dollar gathers strength and weighs on the pair as investors seek refuge in the wake of Israel and the United States' joint attack on Iran.

GBP/USD targets 1.3500 barrier near moving averages

GBP/USD rebounds from the daily losses, trading around 1.3450 during the Asian hours on Monday. The technical analysis of the daily chart indicates an ongoing bearish bias, as the pair trades within a descending channel pattern.

Gold surges on safe-haven demand, closes in on $5,400

Gold benefits from intense risk-aversion on Monday and climbs toward $5,400, setting a fresh monthly-high in the process. Tensions in the Middle East remain high as Israel and Hezbollah continue to exchange strikes following the US-Israel joint attack on Iran over the weekend.

Bitcoin, Ethereum and Ripple under pressure as key supports face breakdown risk

Bitcoin, Ethereum, and Ripple prices trade on the back foot at the start of this week on Monday, after extending losses in the previous week. BTC is on the brink of a breakdown, ETH is capped below key resistance, and XRP risks a crack of the trendline.

The market is paying for insurance, not apocalypse

As expected, this morning felt less like a Monday market open and more like a fire drill. Futures screens flickered red. S&P contracts down almost 1%. Nasdaq off 1.2%. Brent leaped 13% through $80. Gold rose 1.6% toward $5350 before paring some gains. The dollar is strutting mildly. The Swiss franc is quietly doing what it always does in a storm, catching some safe-haven flows.

Starknet unveils strkBTC, shielded Bitcoin transactions on Ethereum Layer 2

Starknet, the Ethereum Layer 2 network developed by StarkWare, today announced strkBTC, a wrapped Bitcoin asset that introduces optional shielding while preserving full DeFi composability.