|

USD/CHF Price Analysis: Trades back and forth around 0.8800

  • USD/CHF trades sideways near 0.8800 as the focus shifts to US economic data.
  • The Swiss economy is expected to have growth at a moderate pace of 0.1% in the last quarter of 2023.
  • Fed policymakers support holding interest rates unchanged in the range of 5.25%-5.50%.

The USD/CHF is stuck in a tight range near the round-level resistance of 0.8800 since Friday’s trading session. The Swiss Franc asset struggles to find a direction as investors await the United States core Personal Consumption Expenditure price index (PCE) and Swiss Q4 Gross Domestic Product (GDP) data for further guidance.

The US Dollar edges down in Tuesday’s trading session. Further action in the US Dollar will be guided by the US core PCE price index data, which will influence market expectations for the Federal Reserve’s (Fed) rate cuts.

Meanwhile, Fed policymakers argue in favor of holding interest rates unchanged in the range of 5.25%-5.50% until they get evidence that inflation will fall sustainably to the required rate of 2%.

On the Swiss front, investors await the Q4 GDP data, which will be published on Thursday. Investors anticipate the economy grew modestly by 0.1% in the October-December quarter against 0.3% in the third quarter of 2023.

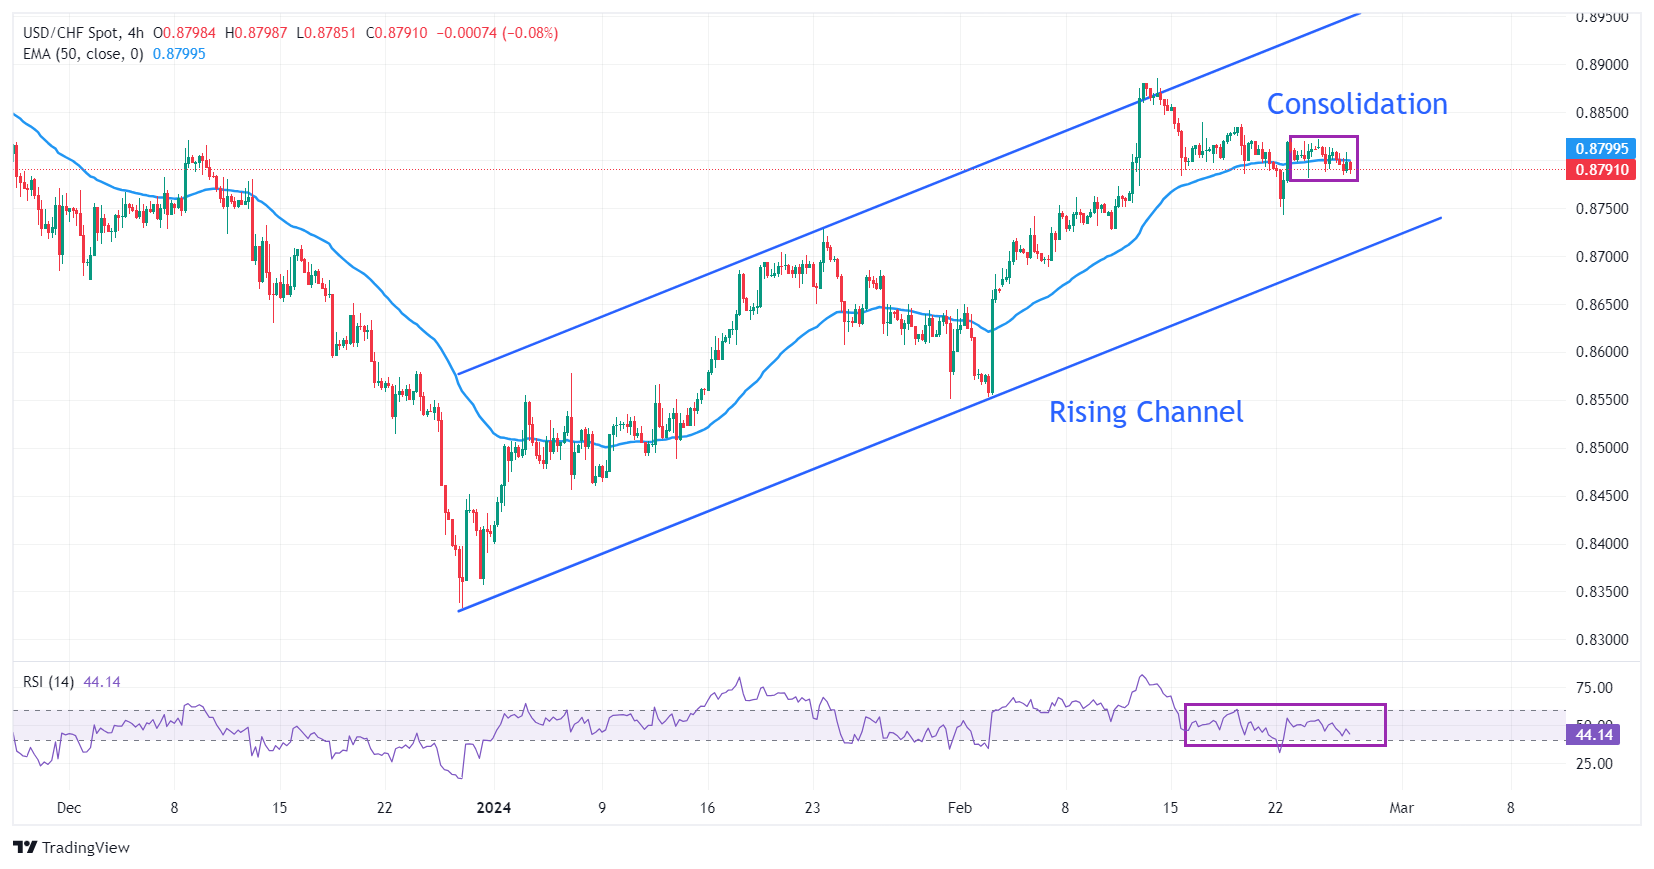
USD/CHF consolidates in a narrow range around 0.8800. The broader outlook remains bullish as the pair trades in a Rising Channel chart pattern formed on a four-hour timeframe. In the aforementioned chart pattern, market participants consider each pullback a buying opportunity.       

The 50-period Exponential Moving Average (EMA) at 0.8800 remains sticky with spot prices, indicating a sideways trend.

The 14-period Relative Strength Index (RSI) oscillates in the 40.00-60.00 range, demonstrating a sharp volatility contraction.

Fresh upside would emerge if the asset breaks above the three-month high of around 0.8886, which would unlock upside towards the September 20 low at 0.8932 and the November 8 low at 0.8976.

On the contrary, a breakdown below February 13 low at 0.8746 would expose the asset to round-level support of 0.8700, followed by February 1 high around 0.8650.

USD/CHF four-hour chart

USD/CHF

Overview
Today last price0.879
Today Daily Change-0.0011
Today Daily Change %-0.12
Today daily open0.8801
 
Trends
Daily SMA200.8753
Daily SMA500.8638
Daily SMA1000.8766
Daily SMA2000.8836
 
Levels
Previous Daily High0.8822
Previous Daily Low0.8788
Previous Weekly High0.8838
Previous Weekly Low0.8742
Previous Monthly High0.8728
Previous Monthly Low0.8399
Daily Fibonacci 38.2%0.8801
Daily Fibonacci 61.8%0.8809
Daily Pivot Point S10.8785
Daily Pivot Point S20.877
Daily Pivot Point S30.8751
Daily Pivot Point R10.882
Daily Pivot Point R20.8838
Daily Pivot Point R30.8854

Author

Sagar Dua

Sagar Dua

FXStreet

Sagar Dua is associated with the financial markets from his college days. Along with pursuing post-graduation in Commerce in 2014, he started his markets training with chart analysis.

More from Sagar Dua
Share:

Editor's Picks

AUD/USD consolidates above 0.7000/two-month low; bearish potential intact

The AUD/USD pair oscillates in a narrow range during the Asian session, and moves little following the release of mixed inflation figures from China. Spot prices currently trade around the 0.7025 region, nearly unchanged for the day, and remain within striking distance of a nearly two-month low set on Tuesday. Renewed hostilities between the US and Iran temper hopes for a deal to end the over three-month-old war.

Japanese Yen languishes despite wholesale inflation accelerates in May

USD/JPY flatlines after experiencing volatility, trading around 160.40 during the Asian hours on Wednesday. The pair continues to hold its ground, reflecting a struggling Japanese Yen that has failed to find support despite a massive acceleration in wholesale inflation. Driven by surging energy costs linked to the ongoing Middle East conflict, Japan’s Producer Price Index jumped 6.3% year-over-year in May. This hot printing comfortably outpaced April’s upwardly revised 5.3% figure and surpassed market consensus of 5.5%, marking the fastest pace of wholesale price growth in three years.

$4,200: Gold retains bearish bias near March low ahead of US CPI

Gold recovers slightly after touching a fresh low since March 23, though it retains a bearish bias near the $4,200 mark through the early European session. Renewed hostilities between the US and Iran fuel inflationary concerns and bolster bets for more hawkish central banks, which is seen as a key factor driving flows away from the non-yielding yellow metal. Furthermore, the decline could be attributed to technical selling following the recent breakdown below the very important 200-day SMA.

Cardano's downtrend deepens despite on-chain bottoming signals

Cardano edges lower to $0.1600 signaling a potential extension of the 30% loss from last week. The altcoin remains under intense selling pressure, weighing on its retail support. Still, a spike in dormant supply re-entering circulation signals that the selling pressure has run its course, a pattern that often precedes a rebound.

US CPI data set to show inflation at three-year high in May, backing Fed hawkish tilt

The US Bureau of Labor Statistics will publish the May Consumer Price Index (CPI) data on Wednesday. The report is expected to show another step up in consumer inflation, driven by the persistently high Oil prices due to the ongoing crisis in the Middle East.

The US economy defies the rules: 100 days into the Oil shock and the recession signal is still missing

More than three months after the start of the Iran war and the resulting disruption to global energy markets, the US economy continues to display remarkable resilience. The conflict has triggered a sharp rise in Oil prices, reignited inflationary pressures and fueled widespread concerns about a potential economic slowdown.