|

USD/CHF Price Analysis: Rises to 0.8850 on firmer US Dollar

  • USD/CHF advances to 0.8860 as higher US core PCE inflation data strengthens US Dollar.
  • The Swiss Franc remains on the back foot as the SNB is expected to lead the global rate-cut cycle.
  • Investors await the US Manufacturing PMI for fresh insights on the economic outlook.

The USD/CHF pair extends its upside to 0.8860 in Friday’s European session. The Swiss Franc asset strengthens due to firm US Dollar and hopes that the Swiss National Bank (SNB) will lead the rate-cut cycle.

The US Dollar Index (DXY), which gauges Greenback’s value against six major currencies, has turned sideways around 104.20 after a sharp recovery from 103.70.

The appeal for the US Dollar improves due to higher United States monthly core Personal Consumption Expenditure Price Index (PCE) data for January, indicating that the Federal Reserve’s (Fed) path to 2% inflation would be bumpy. The monthly core inflation grew by 0.4% as expected, higher than the 0.2% pace necessary to achieve price stability.

Meanwhile, cooling price pressures in the Swiss economy have prompted a chance of rate cuts by the SNB in March. In January, inflation fell to 1.3% against expectations of 1.7%, allowing the SNB to pivot to a dovish monetary policy stance.

In today’s session, market participants will focus on the US ISM Manufacturing PMI for February, which will be published at 15:00 GMT. Investors anticipate factory data to come at 49.5, higher than 49.1 in January but will remain below the 50.0 threshold.

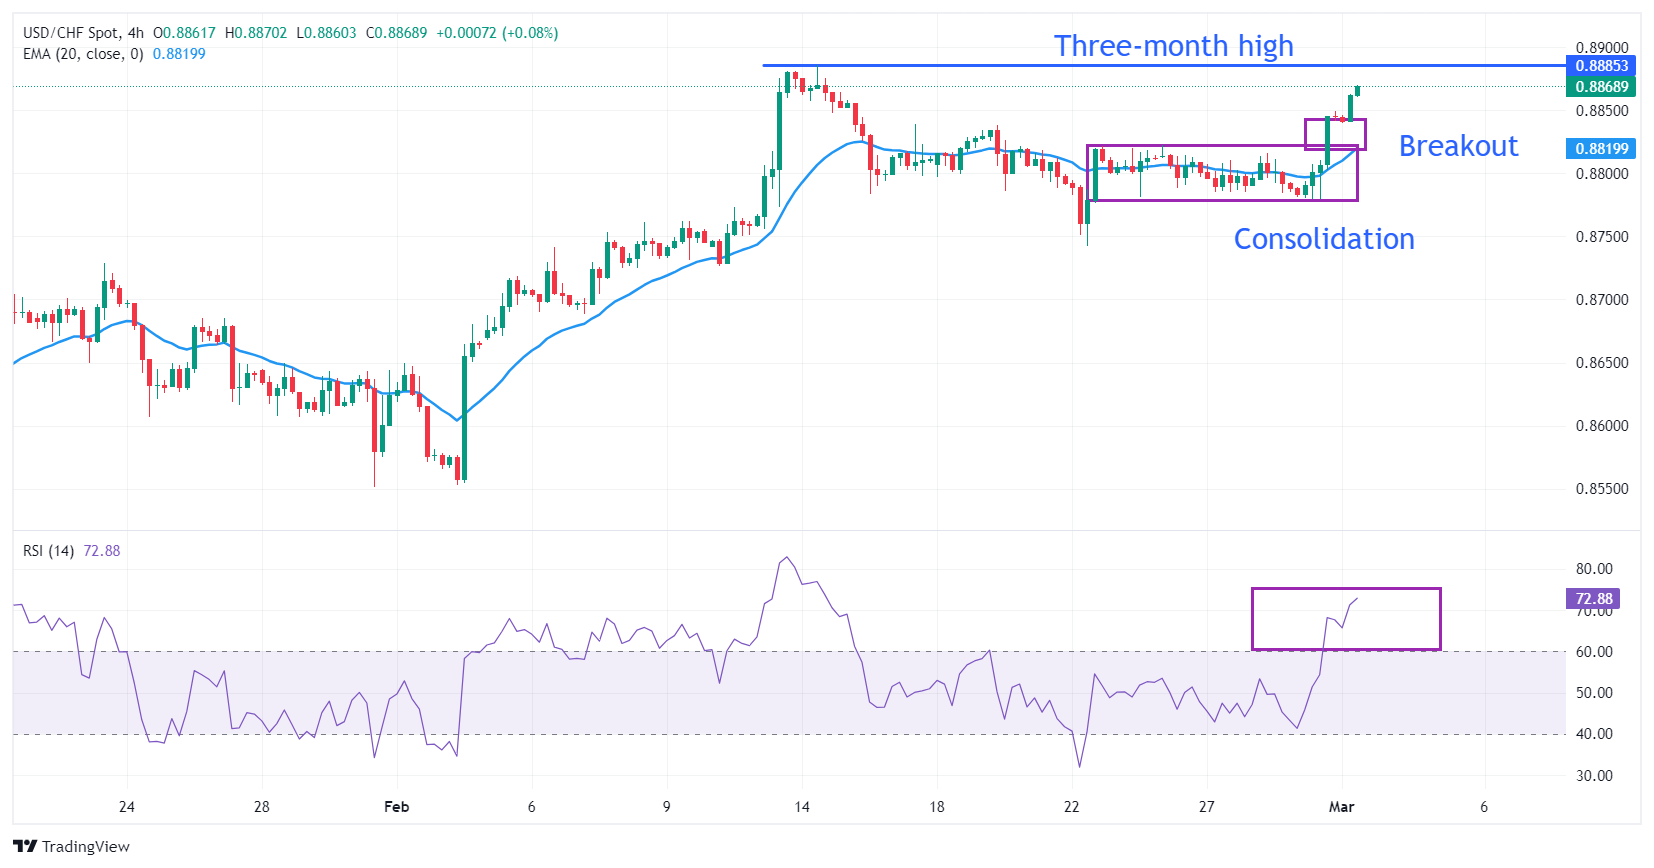
USD/CHF delivers a vertical upside move after a breakout of the consolidation formed between the 0.8778-0.8824 range in a four-hour timeframe. The consolidation formation indicates a sharp contraction in volatility, which exhibits narrow ticks and low volume. A breakout of the same results in a volatility expansion, followed by wider ticks and heavy volume.

The near-term outlook is bullish as the 20-period Exponential Moving Average (EMA) at 0.8821 is sloping higher.

The 14-period Relative Strength Index (RSI) shifts into the bullish range of 60.00-80.00, indicating a positive momentum has been triggered.

Fresh upside would emerge if the asset breaks above the three-month high around 0.8886, which would unlock upside towards September 20 low at 0.8932 and November 8 low at 0.8976.

On the contrary, a breakdown below February 13 low at 0.8746 would expose the asset to the round-level support of 0.8700, followed by February 1 high around 0.8650.

USD/CHF four-hour chart

USD/CHF

Overview
Today last price0.8868
Today Daily Change0.0026
Today Daily Change %0.29
Today daily open0.8842
 
Trends
Daily SMA200.8783
Daily SMA500.8651
Daily SMA1000.8759
Daily SMA2000.8833
 
Levels
Previous Daily High0.8846
Previous Daily Low0.8779
Previous Weekly High0.8838
Previous Weekly Low0.8742
Previous Monthly High0.8886
Previous Monthly Low0.8553
Daily Fibonacci 38.2%0.882
Daily Fibonacci 61.8%0.8805
Daily Pivot Point S10.8799
Daily Pivot Point S20.8756
Daily Pivot Point S30.8733
Daily Pivot Point R10.8866
Daily Pivot Point R20.8889
Daily Pivot Point R30.8932

Author

Sagar Dua

Sagar Dua

FXStreet

Sagar Dua is associated with the financial markets from his college days. Along with pursuing post-graduation in Commerce in 2014, he started his markets training with chart analysis.

More from Sagar Dua
Share:

Editor's Picks

AUD/USD eyes 0.7150 barrier nine-day EMA

AUD/USD inches higher after registering modest losses in the previous day, trading around 0.7130 during the Asian hours. The technical analysis of the daily chart indicates that the pair is moving sideways within the rectangle pattern, suggesting a consolidation as neither the bulls nor the bears have enough momentum to take control of the market.

USD/JPY trades below 160.00 intervention threshold; bullish bias intact

The USD/JPY pair attracts some sellers during the Asian session amid fears that authorities will step in again to prop up the Japanese Yen. Furthermore, the Israel-Lebanon truce prompts some profit-taking around the US Dollar and exerts downward pressure on the currency pair.

Gold defends 200-day SMA, rises toward $4,500

Gold is attempting a tepid recovery toward $4,500 on Thursday, as renewed optimism in the Mideast geopolitical front calms market nerves. This cautious optimism across Asian markets weighs on Oil prices, and diminishes the US Dollar’s safe-haven appeal, helping Gold stage a decent comeback from the weekly low of $4,424.


Hyperliquid: ETF demand, capital rotation fuel HYPE rally as Bitcoin melts

Hyperliquid price sustains an upward trend near its all-time high of $75.76 on Thursday after posting 80% gains in May, while Bitcoin (BTC) retraces below $65,000, triggering a market-wide panic.

Kevin Warsh takes the Fed helm: What it means for the US Dollar
The Federal Reserve moves away from the highly predictable "forward guidance" model of the Jerome Powell era to a new “Kevin Warsh environment”, characterized by less communication, more policy surprises, and an increased focus on the Fed's complex balance sheet.
Recession on paper: What really moves the Canadian Loonie now?

Statistics Canada handed the headline writers a gift and the analysts a headache. Real GDP shrank 0.1% on an annualized basis in the first quarter, and with the fourth quarter of 2025 revised down to a 1.0% contraction, that is two negative quarters in a row, the textbook definition of a technical recession and Canada's first since the pandemic.